advertisement
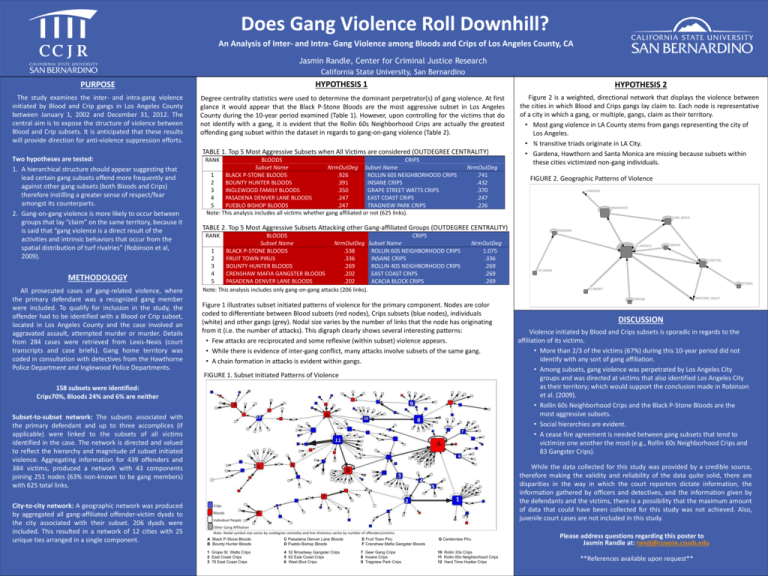
Does Gang Violence Roll Downhill? An Analysis of Inter- and Intra- Gang Violence among Bloods and Crips of Los Angeles County, CA Jasmin Randle, Center for Criminal Justice Research California State University, San Bernardino HYPOTHESIS 1 PURPOSE The study examines the inter- and intra-gang violence initiated by Blood and Crip gangs in Los Angeles County between January 1, 2002 and December 31, 2012. The central aim is to expose the structure of violence between Blood and Crip subsets. It is anticipated that these results will provide direction for anti-violence suppression efforts. HYPOTHESIS 2 Degree centrality statistics were used to determine the dominant perpetrator(s) of gang violence. At first glance it would appear that the Black P-Stone Bloods are the most aggressive subset in Los Angeles County during the 10-year period examined (Table 1). However, upon controlling for the victims that do not identify with a gang, it is evident that the Rollin 60s Neighborhood Crips are actually the greatest offending gang subset within the dataset in regards to gang-on-gang violence (Table 2). TABLE 1. Top 5 Most Aggressive Subsets when All Victims are considered (OUTDEGREE CENTRALITY) Two hypotheses are tested: 1. A hierarchical structure should appear suggesting that lead certain gang subsets offend more frequently and against other gang subsets (both Bloods and Crips) therefore instilling a greater sense of respect/fear amongst its counterparts. 2. Gang-on-gang violence is more likely to occur between groups that lay “claim” on the same territory, because it is said that “gang violence is a direct result of the activities and intrinsic behaviors that occur from the spatial distribution of turf rivalries” (Robinson et al, 2009). METHODOLOGY All prosecuted cases of gang-related violence, where the primary defendant was a recognized gang member were included. To qualify for inclusion in the study, the offender had to be identified with a Blood or Crip subset, located in Los Angeles County and the case involved an aggravated assault, attempted murder or murder. Details from 284 cases were retrieved from Lexis-Nexis (court transcripts and case briefs). Gang home territory was coded in consultation with detectives from the Hawthorne Police Department and Inglewood Police Departments. RANK BLOODS CRIPS Subset Name NrmOutDeg Subset Name 1 BLACK P-STONE BLOODS .926 ROLLIN 60S NEIGHBORHOOD CRIPS 2 BOUNTY HUNTER BLOODS .391 INSANE CRIPS 3 INGLEWOOD FAMILY BLOODS .350 GRAPE STREET WATTS CRIPS 4 PASADENA DENVER LANE BLOODS .247 EAST COAST CRIPS 5 PUEBLO BISHOP BLOODS .247 TRAGNIEW PARK CRIPS Note: This analysis includes all victims whether gang affiliated or not (625 links). NrmOutDeg .741 .432 .370 .247 .226 RANK BLOODS CRIPS Subset Name NrmOutDeg Subset Name 1 BLACK P-STONE BLOODS .538 ROLLIN 60S NEIGHBORHOOD CRIPS 2 FRUIT TOWN PIRUS .336 INSANE CRIPS 3 BOUNTY HUNTER BLOODS .269 ROLLIN 40S NEIGHBORHOOD CRIPS 4 CRENSHAW MAFIA GANGSTER BLOODS .202 EAST COAST CRIPS 5 PASADENA DENVER LANE BLOODS .202 ACACIA BLOCK CRIPS Note: This analysis includes only gang-on-gang attacks (206 links). NrmOutDeg 1.075 .336 .269 .269 .269 Figure 1 illustrates subset initiated patterns of violence for the primary component. Nodes are color coded to differentiate between Blood subsets (red nodes), Crips subsets (blue nodes), individuals (white) and other gangs (grey). Nodal size varies by the number of links that the node has originating from it (i.e. the number of attacks). This digraph clearly shows several interesting patterns: • Few attacks are reciprocated and some reflexive (within subset) violence appears. • While there is evidence of inter-gang conflict, many attacks involve subsets of the same gang. • A chain formation in attacks is evident within gangs. 158 subsets were identified: Crips70%, Bloods 24% and 6% are neither Subset-to-subset network: The subsets associated with the primary defendant and up to three accomplices (if applicable) were linked to the subsets of all victims identified in the case. The network is directed and valued to reflect the hierarchy and magnitude of subset initiated violence. Aggregating information for 439 offenders and 384 victims, produced a network with 43 components joining 251 nodes (63% non-known to be gang members) with 625 total links. RESEARCH POSTER PRESENTATION DESIGN © 2012 www.PosterPresentations.com FIGURE 2. Geographic Patterns of Violence TABLE 2. Top 5 Most Aggressive Subsets Attacking other Gang-affiliated Groups (OUTDEGREE CENTRALITY) FIGURE 1. Subset Initiated Patterns of Violence City-to-city network: A geographic network was produced by aggregated all gang-affiliated offender-victim dyads to the city associated with their subset. 206 dyads were included. This resulted in a network of 12 cities with 25 unique ties arranged in a single component. Figure 2 is a weighted, directional network that displays the violence between the cities in which Blood and Crips gangs lay claim to. Each node is representative of a city in which a gang, or multiple, gangs, claim as their territory. • Most gang violence in LA County stems from gangs representing the city of Los Angeles. • ¾ transitive triads originate in LA City. • Gardena, Hawthorn and Santa Monica are missing because subsets within these cities victimized non-gang individuals. DISCUSSION Violence initiated by Blood and Crips subsets is sporadic in regards to the affiliation of its victims. • More than 2/3 of the victims (67%) during this 10-year period did not identify with any sort of gang affiliation. • Among subsets, gang violence was perpetrated by Los Angeles City groups and was directed at victims that also identified Los Angeles City as their territory; which would support the conclusion made in Robinson et al. (2009). • Rollin 60s Neighborhood Crips and the Black P-Stone Bloods are the most aggressive subsets. • Social hierarchies are evident. • A cease fire agreement is needed between gang subsets that tend to victimize one another the most (e.g., Rollin 60s Neighborhood Crips and 83 Gangster Crips). While the data collected for this study was provided by a credible source, therefore making the validity and reliability of the data quite solid, there are disparities in the way in which the court reporters dictate information, the information gathered by officers and detectives, and the information given by the defendants and the victims, there is a possibility that the maximum amount of data that could have been collected for this study was not achieved. Also, juvenile court cases are not included in this study. Crips Bloods Individual People Other Gang Affiliation Note: Nodal symbol size varies by outdegree centrality and line thickness varies by number of offenders/victims. A Black P-Stone Bloods B Bounty Hunter Bloods C Pasadena Denver Lane Bloods D Pueblo Bishop Bloods E Fruit Town Piru F Crenshaw Mafia Gangster Bloods G Centerview Piru 1 Grape St. Watts Crips 2 East Coast Crips 3 76 East Coast Crips 4 52 Broadway Gangster Crips 5 62 East Coast Crips 6 West Blvd Crips 7 Geer Gang Crips 8 Insane Crips 9 Tragniew Park Crips 10 Rollin 20s Crips 11 Rollin 60s Neighborhood Crips 12 Hard Time Hustler Crips Please address questions regarding this poster to Jasmin Randle at: randj@coyote.csusb.edu **References available upon request**
