1 Direct Variation
advertisement

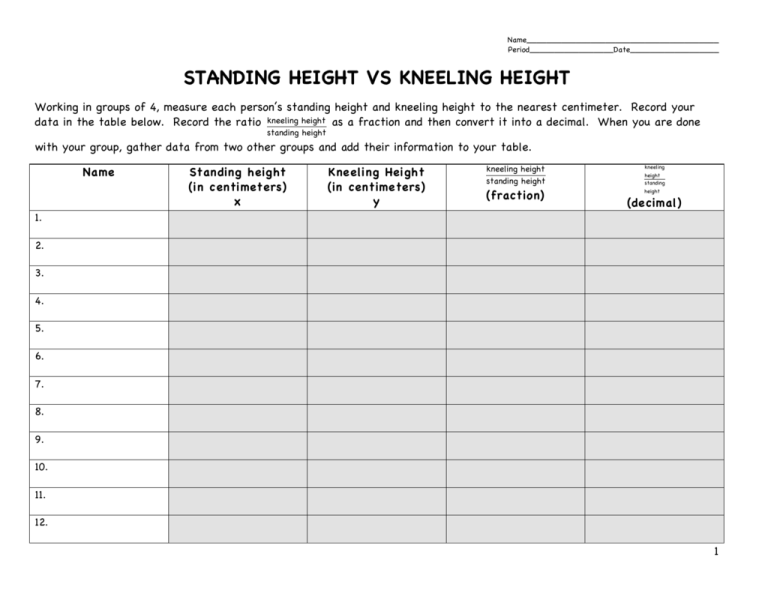
Name_______________________________________ Period_________________Date__________________ STANDING HEIGHT VS KNEELING HEIGHT Working in groups of 4, measure each person’s standing height and kneeling height to the nearest centimeter. Record your data in the table below. Record the ratio kneeling height as a fraction and then convert it into a decimal. When you are done standing height with your group, gather data from two other groups and add their information to your table. Name 1. € height Standing (in centimeters) x Kneeling Height (in centimeters) y € kneeling height standing height kneeling (fraction) height height standing (decimal) € 2. 3. 4. 5. 6. 7. 8. 9. 10. 11. 12. 1 What do you notice about the value of the ratio in the last column under kneeling height ? standing height ____________________________ ____________________________________________________________________________________________ Graph the results from the data, where x is the standing height and€ y is the kneeling height. 160 1. x represents ______________________ y represents ______________________ 150 140 Direct Variation 2. Y varies directly as x means that y = kx where k is the constant of variation. 130 120 Y varies directly as x means that _________ __________________________________ __________________________________ 110 Kneeeling height (in centimeters) 100 90 3. Use your standing height and kneeling height to determine the constant of variation. kneeling height y k= = = standing height x 80 70 60 50 40 € 30 4. If a student has a standing height of 150 centimeters, what is his/her kneeling height? 20 10 http://www.freoo.com/living/forums-for-mens-health/ 10 20 30 40 50 60 70 80 90 100 110 standing height (in centimeters) 120 130 140 150 160 170 180 Leonardo da Vinci measured various distances on the human body in order to make accurate drawings. He determined that in general, the ratio of the kneeling height of a person to his or her standing height is ______.1 1. http://faculty.lasierra.edu/~wclarke/eltyalg/ch950.pdf 2 Name_______________________________________ Period_________________Date__________________ ARM SPAN VS STANDING HEIGHT Copy each person’s standing height from “STANDING HEIGHT VS KNEELING HEIGHT.” Measure each person’s arm span and record his or her measurement in the table below. Write the ratio of arm span as a fraction and then convert it into a standing height decimal. When you are done with your group, gather data from two other groups and add their information to your table. Name 1. Standing Height (in centimeters) x € Arm Span (in centimeters) y € arm span standing height arm span standing height (fraction) (decimal) € 2. 3. 4. 5. 6. 7. 8. 9. 10. 11. 12. 3 What do you notice about the value of the ratio in the last column under arm span ? standing height ____________________________ ____________________________________________________________________________________________ Graph the results from the data, where x is the standing height and€ y is the kneeling height. 160 1. x represents ______________________ y represents ______________________ 150 140 Direct Variation 2. Y varies directly as x means that y = kx where k is the constant of variation. 130 120 Y varies directly as x means that _________ __________________________________ __________________________________ 110 Arm span (in centimeters) 100 90 3. Use your standing height and arm span to determine the constant of variation. arm span y k= = = standing height x 80 70 60 50 40 € 30 4. If a student has a standing height of 150 cm, what is his/her armspan? 20 10 http://www.freoo.com/living/forums-for-mens-health/ 10 20 30 40 50 60 70 80 90 100 110 standing height (in centimeters) 120 130 140 150 160 170 180 Leonardo da Vinci’s Vitruvian Man is based on the ideal proportions of man. He discovered that the ideal ratio of arm span to standing height is ____. 1. http://faculty.lasierra.edu/~wclarke/eltyalg/ch950.pdf 4


