25.2 Heritability of Dermal Ridge Count in Human Fingerprints Is
Robert J. Brooker - Genetica
Esperimento di genetica 25.2
Heritability of Dermal Ridge Count in
Human Fingerprints Is Very High
Fingerprints are inherited as a quantitative trait. It has long been known that identical twins have fingerprints that are very similar, whereas fraternal twins show considerably less agreement. Galton was the first researcher to study fingerprint patterns, but this trait became more amenable to genetic studies in the 1920s, when Kristine Bonnevie, a Norwegian geneticist, developed a method for counting the number of ridges within a human fingerprint.
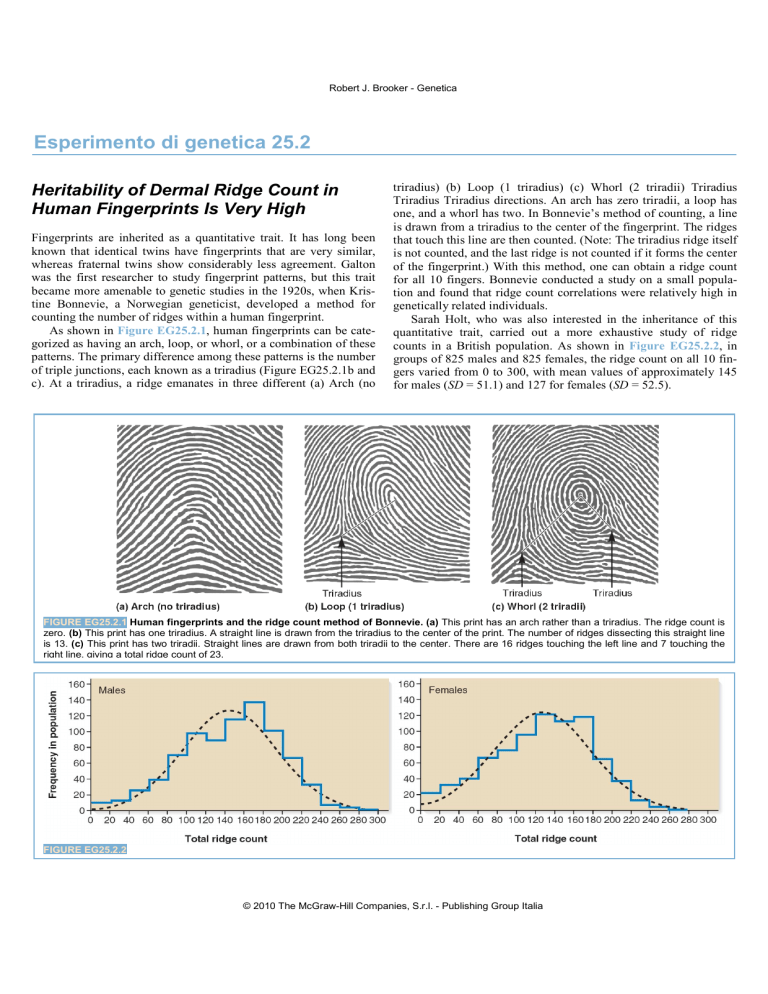
As shown in Figure EG25.2.1
, human fingerprints can be categorized as having an arch, loop, or whorl, or a combination of these patterns. The primary difference among these patterns is the number of triple junctions, each known as a triradius (Figure EG25.2.1b and c). At a triradius, a ridge emanates in three different (a) Arch (no triradius) (b) Loop (1 triradius) (c) Whorl (2 triradii) Triradius
Triradius Triradius directions. An arch has zero triradii, a loop has one, and a whorl has two. In Bonnevie’s method of counting, a line is drawn from a triradius to the center of the fingerprint. The ridges that touch this line are then counted. (Note: The triradius ridge itself is not counted, and the last ridge is not counted if it forms the center of the fingerprint.) With this method, one can obtain a ridge count for all 10 fingers. Bonnevie conducted a study on a small population and found that ridge count correlations were relatively high in genetically related individuals.
Sarah Holt, who was also interested in the inheritance of this quantitative trait, carried out a more exhaustive study of ridge counts in a British population. As shown in Figure EG25.2.2
, in groups of 825 males and 825 females, the ridge count on all 10 fingers varied from 0 to 300, with mean values of approximately 145 for males ( SD = 51.1) and 127 for females ( SD = 52.5).
FIGURE EG25.2.1
Human fingerprints and the ridge count method of Bonnevie. (a) This print has an arch rather than a triradius. The ridge count is zero. (b) This print has one triradius. A straight line is drawn from the triradius to the center of the print. The number of ridges dissecting this straight line is 13. (c) This print has two triradii. Straight lines are drawn from both triradii to the center. There are 16 ridges touching the left line and 7 touching the right line, giving a total ridge count of 23.
FIGURE EG25.2.2
© 2010 The McGraw-Hill Companies, S.r.l. - Publishing Group Italia
Robert J. Brooker - Genetica
Based on these results, Holt decided to conduct a more detailed analysis of ridge counts by examining the fingerprint patterns of a large group of people and their close relatives. In the experiment of
Figure EG25.2.3
, the ridge counts for pairs of related individuals were determined by the method described in Figure EG25.2.2. The correlation coefficients for ridge counts were then calculated among the pairs of related or unrelated individuals. To estimate the narrowsense heritability, the observed correlations were then divided by the expected correlations based on the known genetic relationships.
THE HYPOTHESIS
Dermal ridge count has a genetic component. The goal of this experiment is to determine the contribution of genetics in the variation of dermal ridge counts.
Starting material: A group of human subjects from Great Britain
FIGURE EG25.2.3
Heritability of human fingerprint patterns.
© 2010 The McGraw-Hill Companies, S.r.l. - Publishing Group Italia
Robert J. Brooker - Genetica
THE DATA
Type of Relationship
Parent-child
Parent-parent
Sibling-sibling
Number of Pairs Examined
810
200
642
Correlation
Coefficient(r obs
0.48 ± 0.04*
0.05 ± 0.07
0.50 ± 0.04
)
Heritability r obs
/r exp
0.96
__
†
1.00
Identical twins
Fraternal twins
80
92
0.95 ± 0.01
0.49 ± 0.08
0.95
0.98
0.97 average heritability
* ± = Standard error of the mean.
† We cannot calculate a heritability value because the value for r exp
is not known. Nevertheless, the value for r obs
is very low, suggesting that there is a negligible correlation between unrelated individuals. Adapted from Holt, S. B. (1961). Quantitative Genetics of Finger-Print Patterns. British Med. Bull.
17, 247–250.
INTERPRETING THE DATA
As seen in the data table, the results indicate that genetics plays the major role in explaining the variation in this trait. Genetically unrelated individuals (namely, parent-parent relationships) have a negligible correlation for this trait. By comparison, individuals who are genetically related have a substantially higher correlation. When the observed correlation coefficient is divided by the expected correlation coefficient based on the known genetic relationships, the average heritability value is 0.97, which is very close to 1.0.
What do these high heritability values mean? They indicate that nearly all of the variation in fingerprint pattern is due to genetic variation. Significantly, fraternal and identical twins have substantially different observed correlation coefficients, even though we expect that they have been raised in very similar environments.
These results support the idea that genetics is playing the major role in promoting variation and that the results are not biased heavily by environmental similarities that may be associated with genetically related individuals. From an experimental viewpoint, the results show us how the determination of correlation coefficients between related and unrelated individuals can provide insight regarding the relative contributions of genetics and environment to the variation of a quantitative trait.
© 2010 The McGraw-Hill Companies, S.r.l. - Publishing Group Italia
