The Risks of Conservatism
advertisement
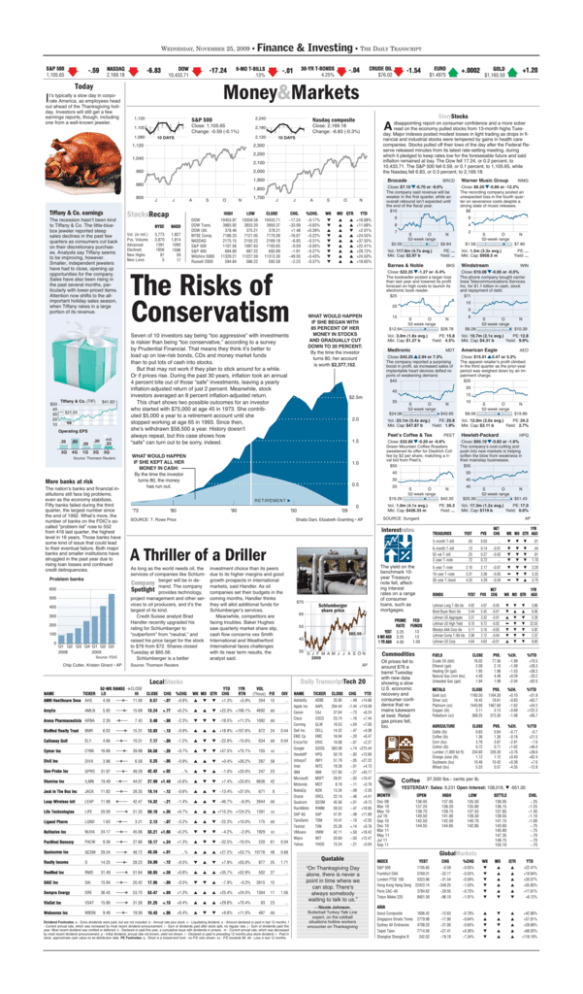
WEDNESDAY, NOVEMBER 25, 2009 • q S&P 500 1,105.65 q NASDAQ 2,169.18 -.59 q DOW 10,433.71 -6.83 6-MO T-BILLS .13% -17.24 Today Finance & Investing • THE DAILY TRANSCRIPT q 30-YR T-BONDS 4.25% -.01 q I 1,120 S&P 500 2,240 Nasdaq composite 1,100 Close: 1,105.65 Change: -0.59 (-0.1%) 2,180 Close: 2,169.18 Change: -6.83 (-0.3%) 1,080 2,120 10 DAYS 1,120 10 DAYS 2,300 2,100 960 2,000 1,900 Brocade 1,800 Close: $7.10 -0.70 or -9.0% The company said revenue will be weaker in the first quarter, while an overall rebound isn’t expected until the end of the fiscal year. $10 880 800 $50 40 30 20 10 Vol. (in mil.) Pvs. Volume Advanced Declined New Highs New Lows $41.83 3Q 4Q 1Q .20 .49 est. .23 2Q 3Q Source: Thomson Reuters More banks at risk The nation’s banks and financial institutions still face big problems, even as the economy stabilizes. Fifty banks failed during the third quarter, the largest number since the end of 1992. What’s more, the number of banks on the FDIC's socalled “problem list” rose to 552 from 416 last quarter, the highest level in 16 years. Those banks have some kind of issue that could lead to their eventual failure. Both major banks and smaller institutions have struggled in the past year due to rising loan losses and continued credit delinquencies. Problem banks 600 500 400 300 200 100 0 A O DOW DOW Trans. DOW Util. NYSE Comp. NASDAQ S&P 500 S&P 400 Wilshire 5000 Russell 2000 NASD 1,827 1,814 1093 1596 59 17 3,773 3,870 1391 1656 87 5 S 1,700 N J Q1 Q2 Q3 Q4 Q1 Q2 Q3 2008 2009 Source: FDIC Chip Cutter, Kristen Girard • AP %CHG. WK MO QTR LOW CLOSE CHG. 10433.71 3950.37 378.21 7170.26 2169.18 1105.65 692.89 11313.30 592.58 -17.24 -33.09 +1.48 -16.07 -6.83 -0.59 -1.91 -49.03 -2.23 YTD s s t s s s s s s +18.88% +11.68% +2.01% +24.55% +37.55% +22.41% +28.72% +24.50% +18.65% ’80 ’90 4 S O 52-week range $2.05 $9.84 BKS S O 52-week range $12.64 S O 52-week range -0.8% s t t +5.9% 204 15 ... AMLN 5.92 8 15.69 13.24 +.77 +6.2% s s t +22.0% +106.1% 4692 dd ... Arena Pharmaceuticls ARNA 2.26 3 7.42 3.40 -.08 -2.3% t t t -18.5% +11.2% 1092 dd ... +1.3% PRIME RATE BioMed Realty Trust BMR 6.02 9 15.31 13.93 -.13 -0.9% s s s +18.9% +107.6% 672 24 0.44 Callaway Golf ELY 4.66 5 10.31 7.17 -.09 -1.2% s t t -22.8% -15.6% 634 dd 0.04 Cymer Inc CYMI 16.66 8 39.99 34.50 -.26 -0.7% s t t +57.5% +75.1% 155 cc ... DivX Inc DIVX 3.96 6.58 5.25 -.05 -0.9% s s t +0.4% +26.2% 287 58 ... Gen-Probe Inc GPRO 31.97 7 49.29 42.42 +.02 ...% s t s -1.0% +33.0% 247 23 ... Illumina Inc ILMN 19.49 4 44.07 27.99 +1.49 +5.6% s t t +7.4% +33.6% 6636 42 ... Jack In The Box Inc JACK 11.82 5 28.35 19.14 -.12 -0.6% s s t -13.4% +37.0% 671 8 ... Leap Wireless Intl LEAP 11.98 1 42.47 14.32 -.21 -1.4% s s t -46.7% -6.0% 2644 dd ... Life Technologies LIFE 20.00 0 51.33 50.18 +.35 +0.7% s s s +115.3% +124.2% 1391 cc ... Ligand Pharm LGND 1.63 2.13 -.07 -3.2% s s t -22.3% +10.0% 175 dd ... NuVasive Inc NUVA 24.17 5 45.06 33.21 +1.65 +5.2% t t t -4.2% -2.0% 1929 cc ... PacWest Bancorp PACW 9.36 5 27.66 18.17 +.24 +1.3% s t t -32.5% -10.5% 220 61 0.04 Qualcomm Inc QCOM 29.34 9 48.72 45.56 +.01 ...% s s s +27.2% +53.7% 10776 48 0.68 Realty Income O 14.25 8 28.23 24.99 -.12 -0.5% t s t +55.0% 25 1.71 3.21 YEST 6 MO AGO 1 YR AGO D J F M A M J J A S ON 2009 +7.9% ResMed Inc RMD 31.49 0 51.64 50.85 +.38 +0.8% s s s +35.7% SAIC Inc SAI 15.94 5 20.42 17.95 -.09 -0.5% t t s Sempra Energy SRE 36.43 0 53.75 53.47 +.69 +1.3% s ViaSat Inc VSAT 15.90 0 31.58 31.25 +.13 +0.4% Websense Inc WBSN 9.48 7 19.56 16.43 +.06 +0.4% 877 +52.9% 502 27 ... -7.9% -0.3% 2615 15 ... s s +25.4% +24.5% 1304 11 1.56 s s s +29.8% +70.4% 83 23 ... s t t +11.0% 487 dd ... +9.8% Dividend Footnotes: a - Extra dividends were paid, but are not included. b - Annual rate plus stock. c - Liquidating dividend. e - Amount declared or paid in last 12 months. f - Current annual rate, which was increased by most recent dividend announcement. i - Sum of dividends paid after stock split, no regular rate. j - Sum of dividends paid this year. Most recent dividend was omitted or deferred. k - Declared or paid this year, a cumulative issue with dividends in arrears. m - Current annual rate, which was decreased by most recent dividend announcement. p - Initial dividend, annual rate not known, yield not shown. r - Declared or paid in preceding 12 months plus stock dividend. t - Paid in stock, approximate cash value on ex-distribution date. PE Footnotes: q - Stock is a closed-end fund - no P/E ratio shown. cc - P/E exceeds 99. dd - Loss in last 12 months. AdobeSy Apple Inc Canon Cisco Corning Dell Inc EMC Cp EricsnTel Google HewlettP InfosysT Intel IBM Microsoft Motorola NokiaCp Oracle Qualcom RschMotn SAP AG TaiwSemi TexInst VMware Wipro Yahoo 40 N $42.20 HPQ S O 52-week range N $25.39 $51.43 Vol.: 17.3m (1.2x avg.) PE: 17.0 Mkt. Cap: $119 b Yield: 0.6% SOURCE: Sungard $65.56 -.07 Hewlett-Packard 45 PE: 35.3 Yield: ... $19.86 Close: $50.19 -0.83 or -1.6% The company’s cost-cutting and push into new markets is helping soften the blow from weakness in their mainstay businesses. $55 50 S O 52-week range N $8.06 30 Vol.: 1.0m (4.1x avg.) Mkt. Cap: $426.33 m Schlumberger share price NAME PEET S O 52-week range Vol.: 12.0m (2.0x avg.) PE: 24.2 Mkt. Cap: $3.11 b Yield: 2.7% 40 20 45 DIV 10 $43.65 Close: $32.86 -0.20 or -0.6% Green Mountain Coffee Roasters sweetened its offer for Diedrich Coffee by $2 per share, matching a rival bid from Peet’s. $50 55 8.57 WK MO QTR AEO Close: $15.01 0.47 or 3.2% The apparel retailer’s profit climbed in the third quarter as the prior-year period was weighed down by an impairment charge. $25 N Vol.: 23.1m (3.4x avg.) PE: 25.8 Mkt. Cap: $47.87 b Yield: 1.9% Daily TranscriptTech 20 VOL (Thous) P/E $10.39 15 35 AP 1YR RTN $6.28 20 AP TREASURIES The yield on the benchmark 10year Treasury note fell, affecting interest rates on a range of consumer loans, such as mortgages. Source: Thomson Reuters N American Eagle MDT $19.29 35 S O 52-week range Medtronic A Thriller of a Driller YTD CHG 8 Vol.: 10.7m (2.1x avg.) PE: 12.8 Mkt. Cap: $4.31 b Yield: 9.9% Peet’s Coffee & Tea 65 WIN Close: $10.08 -0.05 or -0.5% The phone company bought carrier Iowa Telecommunications Services Inc. for $1.1 billion in cash, stock and repayment of debt. $11 $28.78 $24.06 $75 PE: ... Yield: ... Vol.: 3.0m (1.8x avg.) PE: 15.8 Mkt. Cap: $1.27 b Yield: 4.5% $2.5m ’09 $7.80 Windstream 40 0 N $1.58 Vol.: 1.2m (3.3x avg.) Mkt. Cap: $958.5 m N Close: $43.25 2.94 or 7.3% The company reported a surprising boost in profit, as increased sales of implantable heart devices defied reports of weakening demand. $45 1.5 S O 52-week range 9 15 2.0 WMG 10 Interestrates investment choice than its peers due to its higher margins and good growth prospects in international markets, said Handler. As oil companies set their budgets in the coming months, Handler thinks they will allot additional funds for Schlumberger’s services. Meanwhile, competitors are facing troubles. Baker Hughes saw quarterly market share slip, cash flow concerns vex Smith International and Weatherford International faces challenges with its near term results, the analyst said. PE: ... Yield: ... Barnes & Noble WHAT WOULD HAPPEN IF SHE BEGAN WITH 85 PERCENT OF HER MONEY IN STOCKS AND GRADUALLY CUT DOWN TO 20 PERCENT: By the time the investor turns 80, her account is worth $2,377,152. Shaila Dani, Elizabeth Gramling • AP As long as the world needs oil, the services of companies like Schlumwill be in deCompany berger mand. The company Spotlight provides technology, project management and other services to oil producers, and it’s the largest of its kind. Credit Suisse analyst Brad Handler recently upgraded his rating for Schlumberger to “outperform” from “neutral,” and raised his price target for the stock to $76 from $72. Shares closed Tuesday at $65.56. Schlumberger is a better 2 N 20 ’00 SOURCE: T. Rowe Price 6 8 Vol.: 117.0m (4.7x avg.) Mkt. Cap: $2.97 b RETIREMENT ’73 Warner Music Group Close: $6.20 -0.86 or -12.2% The recording company posted an unexpected loss in the fourth quarter on severance costs despite a strong slate of music releases. $8 9 7 0.5 7 11.00 4 s s s s s s s s s 1.0 4.56 5 t t s t t t t t t WHAT WOULD HAPPEN IF SHE KEPT ALL HER MONEY IN CASH: By the time the investor turns 80, the money has run out. %CHG 52-WK RANGE LO -0.17% -0.83% +0.39% -0.22% -0.31% -0.05% -0.27% -0.43% -0.37% N BRCD Close: $22.25 -1.27 or -5.4% The bookseller posted a larger loss than last year and lowered its profit forecast on high costs to launch its electronic book reader. $25 The Risks of Conservatism CHG Amylin O 10359.58 3933.20 375.21 7121.05 2155.22 1097.63 687.22 11227.59 586.22 CLOSE AMN Healthcare Svce AHS S HIGH LocalStocks TICKER A 10453.97 3983.92 378.46 7186.33 2175.15 1107.56 694.80 11329.21 594.84 CLOSE HI NAME J Seven of 10 investors say being “too aggressive” with investments is riskier than being “too conservative,” according to a survey by Prudential Financial. That means they think it’s better to load up on low-risk bonds, CDs and money market funds than to put lots of cash into stocks. But that may not work if they plan to stick around for a while. Or if prices rise. During the past 30 years, inflation took an annual 4 percent bite out of those “safe” investments, leaving a yearly inflation-adjusted return of just 2 percent. Meanwhile, stock investors averaged an 8 percent inflation-adjusted return. This chart shows two possible outcomes for an investor who started with $75,000 at age 45 in 1973. She contributed $5,000 a year to a retirement account until she stopped working at age 65 in 1993. Since then, she’s withdrawn $58,500 a year. History doesn’t always repeat, but this case shows how “safe” can turn out to be sorry, indeed. Operating EPS .20 J NYSE ’09 .85 J StocksRecap $21.05 .35 +1.20 disappointing report on consumer confidence and a more sober read on the economy pulled stocks from 13-month highs Tuesday. Major indexes posted modest losses in light trading as drops in financial and industrial stocks were tempered by gains in health care companies. Stocks pulled off their lows of the day after the Federal Reserve released minutes from its latest rate-setting meeting, during which it pledged to keep rates low for the foreseeable future and said inflation remained at bay. The Dow fell 17.24, or 0.2 percent, to 10,433.71. The S&P 500 fell 0.59, or 0.1 percent, to 1,105.65, while the Nasdaq fell 6.83, or 0.3 percent, to 2,169.18. 2,200 TIffany & Co. (TIF) p GOLD $1,165.50 +.0002 A 1,040 The recession hasn’t been kind to Tiffany & Co. The little-bluebox jeweler reported steep sales declines in the past few quarters as consumers cut back on their discretionary purchases. Analysts say Tiffany seems to be improving, however. Smaller, independent jewelers have had to close, opening up opportunities for the company. Sales have also been rising in the past several months, particularly with lower-priced items. Attention now shifts to the allimportant holiday sales season, when Tiffany rakes in a large portion of its revenue. p EURO $1.4975 -1.54 Money&Markets t’s typically a slow day in corporate America, as employees head out ahead of the Thanksgiving holiday. Investors will still get a few earnings reports, though, including one from a well-known jeweler. Tiffany & Co. earnings q CRUDE OIL $76.02 -.04 TICKER CLOSE CHG YTD ADBE AAPL CAJ CSCO GLW DELL EMC ERIC GOOG HPQ INFY INTC IBM MSFT MOT NOK ORCL QCOM RIMM SAP TSM TXN VMW WIT YHOO 35.95 204.44 37.64 23.74 16.53 14.32 16.94 10.08 583.09 50.19 51.79 19.39 127.93 29.91 8.19 13.34 22.14 45.56 59.53 47.91 10.41 25.28 42.11 20.60 15.24 -.49 +14.66 -1.44 +119.09 -.73 +6.24 -.16 +7.44 +.04 +7.00 -.47 +4.08 -.20 +6.47 -.07 +2.27 +.74 +275.44 -.83 +13.90 -.05 +27.22 -.01 +4.73 -.27 +43.77 -.03 +10.47 -.11 +3.76 -.09 -2.26 -.46 +4.41 +.01 +9.73 -.47 +18.95 -.48 +11.69 -.10 +2.55 +.14 +9.76 +.50 +18.42 -.03 +12.47 -.21 +3.04 3.25 3.25 4.00 FED FUNDS .13 .13 1.00 Commodities 3-month T-bill .03 0.03 ... t t t .01 6-month T-bill 52-wk T-bill 2-year T-note .13 .25 .72 0.14 0.27 0.72 -0.01 -0.02 ... t t t t t t t t t .44 .91 1.19 5-year T-note 2.10 2.17 -0.07 t t t 2.20 10-year T-note 30-year T-bond 3.31 4.25 3.36 4.29 -0.05 -0.04 r r t t t s 3.33 3.75 WK MO QTR 1YR AGO BONDS YEST PVS NET CHG Lehman Long T-Bd Idx Bond Buyer Muni Idx Lehman US Aggregate Lehman US High Yield Moodys AAA Corp Idx Lehman Comp T-Bd Idx Lehman US Corp 4.02 5.44 3.31 9.70 5.11 2.08 4.64 4.07 5.45 3.32 9.72 5.16 2.12 4.63 -0.05 -0.01 -0.01 -0.02 -0.05 -0.04 +0.01 METALS Gold (oz) Silver (oz) Platinum (oz) Copper (lb) Palladium (oz) AGRICULTURE Cattle (lb) Coffee (lb) Corn (bu) Cotton (lb) Lumber (1,000 bd ft) Orange Juice (lb) Soybeans (bu) Wheat (bu) Coffee 1YR WK MO QTR AGO PVS FUELS Crude Oil (bbl) Ethanol (gal) Heating Oil (gal) Natural Gas (mm btu) Unleaded Gas (gal) Oil prices fell to around $76 a barrel Tuesday with new data showing a slow U.S. economic recovery and consumer confidence that remains lukewarm at best. Retail gas prices fell, too. NET CHG YEST t t s r t t s t s t t t t t t s t t t t t 3.96 6.06 5.28 22.03 5.82 2.22 8.60 CLOSE 76.02 2.08 1.95 4.49 1.94 PVS. 77.56 2.10 1.98 4.48 1.98 %CH. -1.99 -1.09 -1.53 +0.29 -2.04 %YTD +70.5 +28.3 +38.3 -20.2 +92.0 CLOSE 1165.50 18.45 1443.80 3.11 369.25 PVS. 1164.30 18.61 1467.60 3.13 373.30 %CH. +0.10 -0.83 -1.62 -0.69 -1.08 %YTD +31.9 +63.7 +54.2 +122.3 +95.7 CLOSE 0.83 1.36 3.76 0.72 234.80 1.12 10.46 5.33 PVS. 0.84 1.36 3.87 0.71 226.30 1.12 10.42 5.57 %CH. -0.77 -0.18 -2.91 +1.62 +3.76 +0.40 +0.38 -4.35 %YTD -0.7 +21.5 -7.6 +46.0 +38.6 +62.4 +7.6 -12.8 37,500 lbs.- cents per lb. YESTERDAY: Sales: 9,231 Open Interest: 108,018, t -651.00 MONTH OPEN HIGH LOW SETTLE CHG. Dec 09 Mar 10 May 10 Jul 10 Sep 10 Dec 10 Mar 11 May 11 Jul 11 Sep 11 136.05 137.20 138.70 140.50 142.50 144.55 137.05 138.20 139.75 141.00 142.50 144.65 135.50 135.80 137.55 139.30 140.70 142.85 136.05 136.15 137.85 139.55 141.15 143.60 145.80 147.35 148.75 150.10 -.25 -1.25 -1.30 -1.10 -1.00 -.75 -.75 -.70 -.70 -.70 GlobalMarkets INDEX “On Thanksgiving Day alone, there is never a point in time where we can stop. There's always somebody waiting to talk to us.” —Nicole Johnson, Butterball Turkey-Talk Line expert, on the oddball situations hotline workers encounter on Thanksgiving YEST S&P 500 1105.65 Frankfurt DAX 5769.31 London FTSE 100 5323.96 Hong Kong Hang Seng 22423.14 Paris CAC-40 3784.62 Tokyo Nikkei 225 9401.58 CHG %CHG WK MO QTR YTD -0.59 -32.17 -31.54 -348.25 -28.55 -96.10 -0.05% -0.55% -0.59% -1.53% -0.75% -1.01% t t t t t t s s s s s t s s s s s t +22.41% +19.94% +20.07% +55.85% +17.61% +6.12% -12.63 -17.90 -31.00 +27.41 -19.18 -0.78% -0.64% -0.65% +0.36% -7.34% s s t t t t s t s s s s s s s +42.86% +57.81% +28.66% +68.03% +118.19% ASIA Seoul Composite Singapore Straits Times Sydney All Ordinaries Taipei Taiex Shanghai Shanghai B 1606.42 2779.98 4708.20 7714.56 242.02 WEDNESDAY, NOVEMBER 25, 2009 • Finance & Investing • THE DAILY TRANSCRIPT For more local finance news log on to: www.sddt.com/finance International MARKET MOVER Markets San Diego Stock Exchange Year-To-Date Consumer confidence in U.S. unexpectedly increased Past Week 110 140 105 115 Foreign Money CHICAGO (AP) — Foreign money futures trading on the Chicago Mercantile Exchange Tuesday. Open High By BOB WILLIS 90 D J-09 F M A M J J A S O Confidence among U.S. consumers unexpectedly rose in November as a brightening outlook masked growing concern over joblessness. The Conference Board’s confidence index increased to 49.5 from 48.7 the prior month. The New York-based Conference Board’s index, which focuses on the labor market and purchase plans, averaged 58 in 2008 and 103.4 in 2007. The report showed Americans fretted over jobs, signaling the highest unemployment rate in 26 years may restrain spending and limit the recovery from the worst recession since the 1930s. Target Corp. (NYSE: TGT) last week said it remains cautious about sales this quarter and expects to offer incentives to spur holiday shopping. “Labor market perceptions are very weak,” said David Sloan, chief U.S. economist at 4Cast Inc. in New York, who forecast an increase in confidence. “What did drive is up was expectations, optimism that things will get better, not that things have gotten better.” Other reports Tuesday showed home prices rose and the economy grew at a slower pace last quarter as consumer spending climbed less than the government previously estimated. Federal Reserve Chairman Ben S. Bernanke last week said joblessness and limited bank lending were “headwinds” for the economy. Economists forecast confidence would decrease to 47.3 from a previously reported 47.7 for October, according to the median of 74 projections in a Bloomberg News survey. Estimates ranged from 40.7 to 53. The S&P/Case-Shiller home-price index of 20 U.S. cities increased 0.3 percent in September from the prior month on a seasonally adjusted basis after a 1.1 percent rise in August, the group said Tuesday in New York. The gauge fell 9.4 percent from September 2008, the smallest year-over-year decline since the end of 2007. The world’s largest economy expanded at a 2.8 percent annual rate in the third quarter, down from the 3.5 percent pace estimated last month, the Commerce Department reported Tuesday. The figures also showed corporate profits climbed 10.6 percent, the most in five years. The Conference Board’s measure of present conditions decreased to 21, the lowest level in 26 years, from 21.1 the prior month. The decrease reflected growing concern over unemployment with a measure of job availability reaching the lowest level since 1983. The share of consumers who said jobs are plentiful fell to 3.2 percent from 3.5 percent, according to the Conference Board. The proportion of people who said jobs are hard to get increased to 49.8 percent from 49.4 percent. The gauge of expectations for the next six months climbed to 68.5 from 67 the prior month. The proportion of people who expect their incomes to rise over the next six months decreased to 10 percent from 10.7 percent. The share expecting more jobs dropped to 15.2 percent from 16.8 percent. Buying plans for automobiles and real estate dropped this month, the report showed. Home-buying expectations decreased to the lowest level since 1982. “Income expectations remain very pessimistic and consumers are entering the holiday season in a very frugal mood,” Lynn Franco, director of the Conference Board’s Consumer Research Center, said in a statement. The United States has lost 7.3 million jobs since the recession began in December 2007 and more losses are forthcoming. Goldman Sachs Group Inc. (NYSE: GS) chief U.S. economist Jan Hatzius forecast earlier this month that unemployment would average 10.4 percent next year. Source Code: 20091124fq 95 65 N T W N T F M T Close: 103.31 Change: +0.60, +0.58% Dow Jones Industrial Average 14,000 10,650 11,000 10,400 8,000 10,150 5,000 N D J- F M A M J 09 J A 9,900 S O N T W T F M T Close: 10,433.71 Change: -17.24, -0.16% NASDAQ 2,600 2,260 2,100 2,200 1,600 2,140 1,100 N D J- F M A M J 09 J A S O N 2,080 T W T F M T Close: 2,169.18 Change: -6.83, -0.31% S&P 500 1,400 1,135 1,100 1,110 800 1,085 500 N D J- F M A M J 09 J A S O N 1,060 T W T F M T Close: 1,105.65 Change: -0.59, -0.05% Dec 09 .9466 .9469 .9394 .9455 Mar 10 .9459 .9467 .9397 .9455 Jun 10 .9450 .9462 .9397 .9452 Sep 10 .9429 .9463 .9411 .9447 Dec 10 .9432 .9455 .9406 .9441 Mar 11 .9435 Last spot Mon’s sales 67,613 Mon’s open int 90,223, up 778 DAILY LOW 52 WEEK CLOSE NET CHG %CHG HIGH Dec 09 Mar 10 Jun 10 Sep 10 10,453.97 10,359.58 3,983.92 3,933.20 378.46 375.21 3,504.62 3,473.97 10,433.71 3,950.37 378.21 3,496.04 -17.24 -33.09 +1.48 -9.16 % CHG 10,495.61 4,066.40 388.86 3,525.97 6,469.95 2,134.21 288.66 2,180.87 +23.05 +18.88 +16.41 +11.68 +1.38 +2.01 +16.51 +13.28 Comp Financial Healthcare NASDAQ 7,186.33 4,915.80 6,356.79 7,121.05 4,854.64 6,287.08 7,170.26 -16.07 -.22 4,872.95 -42.85 -.87 6,341.49 +42.65 +.68 7,266.51 5,147.18 6,340.66 4,181.75 2,060.29 4,262.11 +33.39 +24.55 +38.75 +26.62 +30.22 +18.74 Nasdaq100 Banks Insurance Telecom Computer Biotech S&P 1,792.18 1,608.41 3,535.25 211.01 1,106.46 811.60 1,776.10 1,588.97 3,503.06 208.93 1,096.06 801.68 1,786.25 1,607.28 3,535.21 209.90 1,102.01 811.11 1,814.25 2,050.49 3,638.58 220.19 1,124.90 866.74 1,040.41 1,166.85 2,376.42 124.92 585.69 605.38 +56.33 -18.65 +12.70 +53.74 +70.28 +24.35 +47.42 -20.67 -1.81 +43.48 +61.14 +11.18 S&P 100 S&P 500 S&P MidCap S&P SmallCap OTHER 516.91 1,107.56 694.80 314.79 512.20 1,097.63 687.22 310.39 515.79 1,105.65 692.89 313.48 -.21 -.59 -1.91 -1.37 -.04 -.05 -.27 -.44 517.88 1,113.69 717.75 329.73 317.37 666.79 397.97 181.32 +24.32 +28.96 +43.27 +31.45 +19.52 +22.41 +28.72 +16.65 Wilshire 5000 11,329.21 Value Line Arith 2,153.11 Russell 2000 594.84 11,227.59 2,127.34 586.22 11,313.30 2,145.89 592.58 -49.03 -7.31 -2.23 -.43 -.34 -.37 11,470.47 2,239.69 625.30 6,772.29 992.45 342.59 6 mos. 1 yr. Allstate Bank 1,000 1.15% 1.45% Bank of Internet, USA 1,000 1.20% 1.70% California Bank & Trust 5,000 0.35% 0.55% California Community Bank 2,500 1.06% 1.33% Community Commerce Bank 10,000 1.36% 1.76% 1,000 0.80% 1.51% Coronado First Bank +32.82 +24.50 +76.19 +52.76 +33.71 +18.65 Embarcadero Bank 2,500 1.36% 1.76% 500 0.60% 1.00% 1st Pacific Bank 10,000 1.35% 1.60% 6 months, 0.49 1 year, 1.02 Treasury Bill auction results: average discount rate: 3-month as of Nov. 23: 0.04 6-month as of Nov. 23: 0.14 Treasury Bill annualized rate on weekly average basis, yield adjusted for constant maturity, 1-year, as of Nov. 23: 0.29 Treas. Bill market rate, 6 Mos: 0.13 Treas. Note market rate, 10-year as of 5pm :3.31 Fed Home Loan 11th District Cost of Funds: As of Oct 30: 1.272 Money market fund: Fidelity Cash Reserves: 7 day average yield: 0.12 x - holiday n.a. - not available Home Bank of California 10,000 1.01% 1.41% La Jolla Bank 10,000 1.50% 1.80% Pacific Mercantile Bank 10,000 1.52% 1.92% Pacific Trust Bank 5,000 —— 0.00% San Diego National Bank 1,000 0.25% 0.40% US Bank 1,000 1.15% 1.15% London Interbank Offered Rate M A M J J A S Close: 3.25%, unchanged 52-Week High: 4.00% 52-Week Low: 3.25% O N $85 $81 $60 $77 $20 N D J- F M A M J 09 J A S O N $73 T W T F M T Close: $74.92 Change: -1.64, -2.14% Oil NEW YORK (AP) — Futures trading the New York Mercantile Exchange Tuesday: Open High Low Settle Chg. LIGHT SWEET CRUDE 1,000 bbl.- dollars per bbl. Jan 10 Feb 10 Mar 10 Apr 10 May 10 Jun 10 Jul 10 Aug 10 Sep 10 Oct 10 Nov 10 Dec 10 Jan 11 Feb 11 Mar 11 Apr 11 May 11 75.84 77.09 78.04 78.82 79.80 80.43 80.85 81.25 81.65 81.89 82.34 82.90 77.80 78.72 79.53 80.31 80.89 81.55 82.08 81.34 82.69 82.18 82.54 84.31 75.60 76.02 -1.54 76.67 77.19 -1.31 77.65 78.18 -1.15 78.57 78.96 -1.11 79.26 79.66 -1.08 79.87 80.28 -1.05 80.40 80.79 -1.03 81.18 81.24 -1.02 81.62 81.66 -1.01 81.89 82.08 -1.02 82.34 82.54 -1.02 82.47 83.02 -1.02 83.32 -1.02 83.58 -1.02 83.86 -1.03 84.13 -1.04 84.37 -1.05 Open High Low Settle Chg. Jun 11 84.50 84.57 84.50 84.57 Jul 11 84.77 Aug 11 84.97 Sep 11 85.18 Oct 11 85.39 Nov 11 85.60 Dec 11 86.00 87.03 85.47 85.82 Jan 12 85.97 Feb 12 86.11 Mar 12 86.25 Apr 12 86.38 May 12 86.51 Jun 12 86.64 Jul 12 86.77 Aug 12 86.90 Sep 12 87.03 Oct 12 87.16 Mon’s sales 619,947 Mon’s open int 1,163,343, up 20,781 -1.06 -1.07 -1.08 -1.08 -1.08 -1.09 -1.09 -1.10 -1.10 -1.10 -1.11 -1.12 -1.13 -1.14 -1.15 -1.16 -1.17 Top Performing Mutual Funds for November 24 MFS Funds A: MALA t Fidelity Selects: MdEqSys N New Century Funds: Intl tf Flex Funds: AggGr pf N Flex Funds: StratGr pf N New Century Funds: Capital pf Flex Funds: DynaGr pf N PearlTotR ff N Flex Funds: Muir fpf N Fidelity Selects: NtGas N JennisonDryden B: HlthSciB JennisonDryden C: HlthSciC JennisonDryden Z&I: HlthSciZ Munder Funds: HlthcrA p Munder Funds B: HlthcrB p Munder Funds C/II: HlthcreC p Putnam Funds A: GlblHlthA Putnam Funds C: GlblHlthC t Putnam Funds M: GlblHlth p Putnam Funds Y: GlblHlth TICKER CLOSE NET CHG % CHG YTD RETURN MFALX FSMEX NCFPX FLAGX FLFGX NCCPX FLDGX PFTRX FLMFX FSNGX PHLBX PHLCX PHSZX MFHAX MFHBX MFHCX PHSTX PCHSX PHLMX PHSYX 10.53 23.70 13.57 6.76 7.91 14.05 6.95 9.93 4.95 30.08 17.12 17.12 19.45 23.63 21.46 21.44 46.16 42.15 42.34 47.28 +.27 +.41 +.23 +.09 +.10 +.18 +.08 +.11 +.05 +.26 +.15 +.15 +.17 +.21 +.19 +.19 +.41 +.38 +.37 +.42 +2.6 +1.8 +1.7 +1.3 +1.3 +1.3 +1.2 +1.1 +1.0 +.9 +.9 +.9 +.9 +.9 +.9 +.9 +.9 +.9 +.9 +.9 NE +28.5 +38.7 +30.3 +33.6 +26.1 +26.8 +24.9 NA +49.1 +19.0 +19.0 +20.1 +13.7 +12.9 +12.9 +23.2 +22.4 +22.6 +23.4 Bottom Performing Mutual Funds for November 24 Fidelity Invest: JpnSm N GMO Trust III: FlexEqIII GMO Trust VI: FlexEqVI JennisonDryden B: NatResB x ING Funds Cl A: RussiaA p World Funds: EastEuro r Dimensional Fds: Japan N MtzEurEm t RiverSource A: LaSMoDv px RiverSource C: LaSMoDiv tx AdelantRE Y Fidelity Invest: RealE N ING T,M,Q&I: RealEstI JPMorgan R Cl: RltyIncm N JennisonDryden A: NatResA x MorganStanley Inst: IntlSCpI N Northeast Investors: Trust x PNC Funds: DivREstI x Price Funds Adv: RealEstA N Price Funds: RealEst N 5-year Treasury Rate TICKER CLOSE NET CHG % CHG FJSCX GFEFX GFFEX PRGNX LETRX VEEEX DFJSX MPYMX SREAX SRECX LLUYX FRESX CRARX JRIRX PGNAX MSISX NTHEX PDRIX PAREX TRREX 7.92 18.04 18.06 37.53 32.36 23.08 13.28 25.76 3.35 3.35 7.13 18.71 10.58 6.93 44.02 11.99 5.75 5.24 12.94 12.84 -.18 -.37 -.37 -.75 -.62 -.44 -.25 -.47 -.06 -.06 -.12 -.32 -.18 -.12 -.75 -.21 -.10 -.09 -.23 -.22 -2.2 -2.0 -2.0 -2.0 -1.9 -1.9 -1.8 -1.8 -1.8 -1.8 -1.7 -1.7 -1.7 -1.7 -1.7 -1.7 -1.7 -1.7 -1.7 -1.7 YTD RETURN +10.5 -14.1 -14.0 +67.8 +133.1 +84.9 +.2 +103.9 +14.6 +13.8 +11.9 +22.5 +18.9 +21.3 +68.8 +26.1 +51.4 +23.7 +21.6 +21.1 10-year Treasury Rate 3.5% 4.0% 4.4% 3.1% 3.8% 2.2% 3.2% 1.3% 2.6% 2.5% 1.5% 1.0% F -.0046 -.0047 -.0047 -.0047 -.0047 -.0047 Past Week $100 *Call for specific terms and conditions All figures shown are Annual Percentage Yields rounded to the nearest 100th, unless otherwise noted. All information shown is for comparison only and subject to change without notice. Specific rates/yields should be verified prior to making an investment decision. Provided by: Fouts Financial (800) 587-1400 3.0% J-09 +.0057 +.0056 +.0056 +.0056 $140 (as of 11/24/2009) 5.0% D Dec 09 .9224 .9239 .9114 .9185 Mar 10 .9147 .9150 .9029 .9098 Jun 10 .9000 Sep 10 .8900 Dec 10 .8800 Mar 11 .8700 Last spot Mon’s sales 74,425 Mon’s open int 120,166, off 428 Mutual Funds Deposit 7.0% N AUSTRAL. DOLLAR 100,000 dollars, $ per A $ Year-To-Date Minimum Institution Money U.S. Prime Rate +.0011 +.0011 +.0010 +.0009 +.0007 +.0005 NYMEX Crude Oil, December San Diego County’s Certificate Of Deposit Yields First Bank NEW YORK (AP) _ Money rates for Tuesday. Prime Rate: 3.25 Discount Rate Primary: 0.50 Discount Rate Secondary: 1.00 Broker call loan rate: 2.00 Federal funds target rate: 0.00-0.25 Certificates of Deposit Retail: 1 month, 0.50 3 months, 0.77 6 months, 1.12 1 year, 1.56 Jumbo CDs: 1 month, 0.50 3 months, 0.84 6 months, 1.16 1 year, 1.58 London Interbk Offered Rate: 3 months, 0.26 Dec 09 .9901 .9927 .9850 .9919 Mar 10 .9898 .9929 .9858 .9924 Jun 10 .9905 .9929 .9892 .9929 Sep 10 .9936 Dec 10 .9947 Mar 11 .9958 Last spot Mon’s sales 45,980 Mon’s open int 53,217, up 2,566 Oil Am Eagle & Buff 1 oz: ..........................$1061.50 Mexico 50 Peso: ......................................$1221.30 U.S. $20 Liberty BU:..............................$1060.00 90% Silver Coin $1000 Face Value Bag: ....................................$14320.00 100 oz JM/ENG Silver Bar: ................$2057.00 US Gold Close: ..........................................$1001.40 US Silver Close: ............................................$20.22 US Patinum Close: ..................................$1960.00 US Palladium Close: ................................$466.00 Krugerrand:................................................$1020.40 Canada Mleaf 1 oz: ................................$1024.40 % CHG -.17 -.83 +.39 -.26 -6.69 -.37 -3.46 -.21 +1.54 +.04 -1.14 -.54 -5.41 -.49 +3.77 +.47 Settle Chg SWISS FRANC 125,000 francs, $ per franc -.0020 -.0020 -.0021 -.0020 -.0020 -.0020 1.1234 1.1319 1.1229 1.1294 1.1260 1.1321 1.1237 1.1298 1.1307 1.1312 1.1304 1.1304 1.1317 Low YTD LOW DJ STOCKS 30 Indus 20 Transp 15 Utils 65 Stocks NYSE -.0029 -.0029 -.0032 -.0034 -.0036 -.0038 JAPANESE YEN 12.5 million yen, $ per 100 yen TUESDAY’S Prices HIGH Open High Dec 10 1.1338 +.0056 Mar 11 1.1359 +.0056 Last spot Mon’s sales 68,613 Mon’s open int 128,550, up 628 CANADIAN DOLLAR 100,000 dollars, $ per Cdn. dlr San Diego Silver & Gold Coin Market Courtesy of Old Coin Shop Indexes Settle Chg Dec 09 1.6612 1.6617 1.6495 1.6589 Mar 10 1.6623 1.6623 1.6486 1.6578 Jun 10 1.6571 1.6571 1.6510 1.6565 Sep 10 1.6550 1.6550 1.6549 1.6549 Dec 10 1.6528 Mar 11 1.6507 Last spot Mon’s sales 76,838 Mon’s open int 88,622, off 2,072 Bloomberg News 100 Low BRITISH POUND 62,500 pounds, $ per pound 0.4% 0.5% N D J-09 F M A M J J A Close: 1.01%, -0.01% 52-Week High: 2.84% 52-Week Low: 1.01% S O N N D J-09 F M A M J J A Close: 2.15%, -0.05% 52-Week High: 2.95% 52-Week Low: 1.26% S O N 2.0% N D J-09 F M A M J J A Close: 3.32%, -0.05% 52-Week High: 3.98% 52-Week Low: 2.08% S O N
