Watson Pharmaceuticals Inc. - University of Oregon Investment Group
advertisement
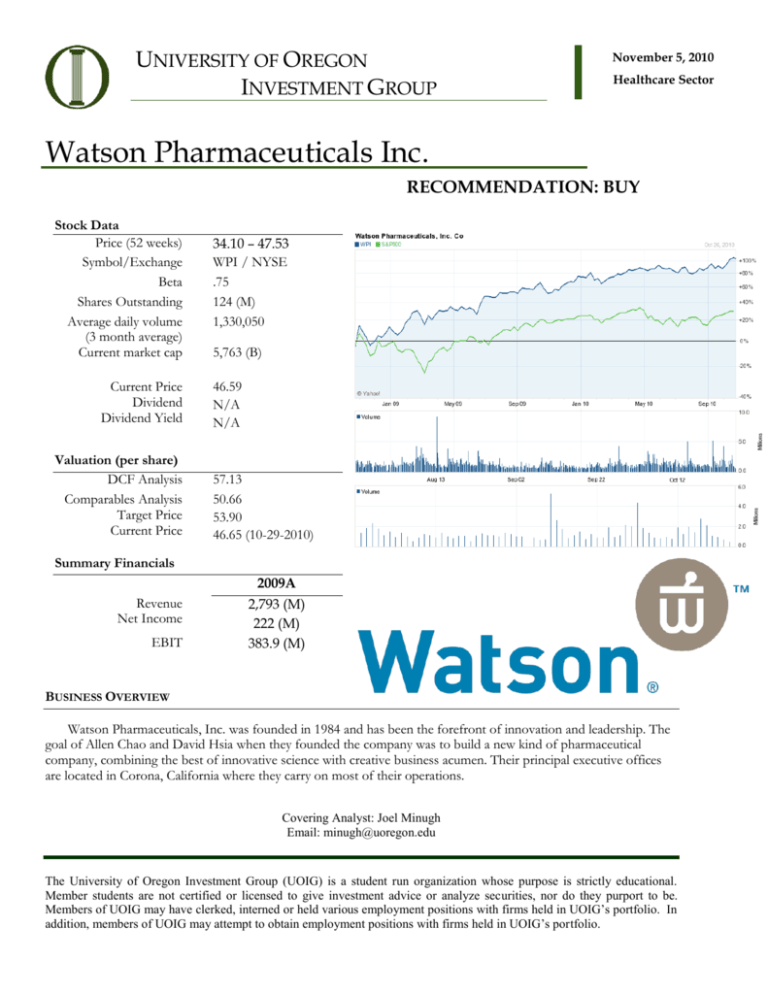
UNIVERSITY OF OREGON INVESTMENT GROUP November 5, 2010 Healthcare Sector Watson Pharmaceuticals Inc. RECOMMENDATION: BUY Stock Data Price (52 weeks) Symbol/Exchange Beta Shares Outstanding Average daily volume (3 month average) Current market cap Current Price Dividend Dividend Yield Valuation (per share) DCF Analysis Comparables Analysis Target Price Current Price 34.10 – 47.53 WPI / NYSE .75 124 (M) 1,330,050 5,763 (B) 46.59 N/A N/A 57.13 50.66 53.90 46.65 (10-29-2010) Summary Financials 2009A Revenue Net Income EBIT 2,793 (M) 222 (M) 383.9 (M) BUSINESS OVERVIEW Watson Pharmaceuticals, Inc. was founded in 1984 and has been the forefront of innovation and leadership. The goal of Allen Chao and David Hsia when they founded the company was to build a new kind of pharmaceutical company, combining the best of innovative science with creative business acumen. Their principal executive offices are located in Corona, California where they carry on most of their operations. Covering Analyst: Joel Minugh Email: minugh@uoregon.edu The University of Oregon Investment Group (UOIG) is a student run organization whose purpose is strictly educational. Member students are not certified or licensed to give investment advice or analyze securities, nor do they purport to be. Members of UOIG may have clerked, interned or held various employment positions with firms held in UOIG’s portfolio. In addition, members of UOIG may attempt to obtain employment positions with firms held in UOIG’s portfolio. Watson Pharmaceuticals Inc. University of Oregon investment group http://uoig.uoregon.edu Watson engages in the development, manufacturing, sale, along with the distribution of generic and brand pharmaceuticals products. Watson’s pharmaceutical products in the U.S are generally marketed as either generic or brand pharmaceuticals. Generic pharmaceutical products offer a cost-efficient alternative to brand products which can often be very expensive. Through their distribution segment, they distribute pharmaceutical products, which have been commercialized by either Watson or other companies, to independent and chain pharmacies and physicians. Their Global Generics mainly operates in the U.K. and Western Europe. In these segments there is often limited generic substitution by pharmacist and because of this products are often promoted by the pharmacies. In the fiscal year of 2009 their revenues were broken down into four segments Generic, Brand, Distribution, and Other with the following percentages respectively: 59%, 14%, 24%, and 3%. An important event to recognize was their recent acquisition of Arrow on December 2nd, 2009. This consisted of Robin Hood Holdings Limited, a Malta private limited liability company, and Cobalt Laboratories. Arrow group was founded in 2000 and has been one of the fastest growing pharmaceutical companies in the world. Over the past 7 years they have invested more than 320 mil in research and development and seen revenues growing from, 18 mil in 2001, to 647 mil in 2008. Along with the acquisition they also gained a 36% ownership interest in Eden Biopharm Group, a company involved in manufacturing early-stage biotech companies. BUSINESS AND GROWTH STRATEGIES Watson has three key strategies to grow their three segments, internal development of differentiated and high demand products, establishment of strategic alliance, and collaborations and acquisition of products and companies that complement their existing portfolio. With their new acquisition of Arrow, they now have commercial operations in locations that were untouched before. This will allow for rapid growth in emerging markets around the world. With their global presence they will be able to diversify their revenues and limit their risk through diversification. In their Global Generic segment they plan on expanding their position in the U.S generics market and strengthening their global position. The Arrow Acquisition is a good example of how they are going to imply this strategy. With this new acquisition they now have established international markets. With these acquisitions of companies that already have a positive image in a certain region, allows them to speed up the process of getting their brands known. Watson will make intelligent acquisitions in order to gain market growth throughout the worldwide segment. Along these lines with their core brand products they also may see a slight decline to generic products as 2 Watson Pharmaceuticals Inc. University of Oregon investment group http://uoig.uoregon.edu patents run out, Watson plans to also distribute generic products of third party companies to complement their core business. Also with continuous application for new patents along with patents of brand drugs coming to an end this will allow Watson penetrate markets unseen before. In 2009 they expanded their generic products with the launch of 8 generic products. In their Global Brand Segment which includes many pharmaceutical products in which the top 30 represent 60% of the total Global Brand segment revenues. With their brand segment they have to worry very little about market penetration as the first to introduce a product is usually the single provider within the market. To grow in this market they will continue to market their brand products in which they already have 350 sales professionals working. In their Distribution segment which primarily distributes generic and selected brand pharmaceutical products to independent pharmacies along with other chains. They plan to grow through three main components, competitive pricing, responsive customer service, and well established telemarketing relationships with their customers. Their responsive customer care will allow people to gain access to healthcare products via next day delivery to the entire U.S. Projected R&D Submissions MANAGEMENT AND EMPLOYEE RELATIONS Paul M. Bisaro at age 49 is the President and Chief Executive officer since September 2007. Prior to joining Watson, Mr. Bisaro was President and Chief Operating Officer of Barr Pharmaceuticals, Inc. His total annual compensation is $1,288,462, with salary consisted of $1,038,462 and bonus being $250,000. G. Frederick Wilkinson at age 53 is the Executive Vice President. Prior to joining Watson, Wilkinson was the President and Chief Operation Officer of Duramed Pharmaceuticals, Inc. Mr. Wilkinson has an extensive list of previous positions that makes him a core part to the Watson family, and an important leader going forward. Relations with employees are good; currently they have 6,000 members which provide 350 generic products to emerging markets. 3 Watson Pharmaceuticals Inc. University of Oregon investment group http://uoig.uoregon.edu RECENT NEWS MORRISTOWN, N.J., Oct 27, 2010 /PRNewswire via COMTEX Watson Pharmaceuticals, Inc. (NYSE: WPI) today confirmed that its subsidiary, Watson Laboratories, Inc., filed a new drug application under Section 505(b)(2) of the Federal Food and Drug Cosmetic Act (FFDCA) with the U.S. Food and Drug Administration (FDA) seeking approval to market rosuvastatin zinc 5, 10, 20 and 40 mg tablets. Watson's rosuvastatin zinc tablets are a new salt version of AstraZeneca's Crestor (R) tablets. Crestor(R) is indicated, as an adjunct to diet, to lower LDL cholesterol, raise HDL cholesterol, and slow the progression of atherosclerosis. MORRISTOWN, N.J., Aug 05, 2010 /PRNewswire via COMTEX Watson Pharmaceuticals, Inc. (NYSE: WPI) today reported net revenue grew 29 percent for the second quarter ended June 30, 2010 to $875.3 million, compared to $677.8 million in the second quarter 2009. On an adjusted cash basis, net income increased 22 percent to $102.8 million or $0.83 per share, compared to $84.2 million or $0.73 per share in the second quarter 2009. GAAP earnings for the second quarter 2010 were $0.57 per share, compared to $0.46 per share in the prior year period. Adjusted EBITDA increased 26 percent to $207.4 million for the second quarter 2010, versus $164.1 million for the second quarter 2009. Cash and marketable securities were $236.1 million as of June 30, 2010. Please refer to the attached reconciliation tables for adjustments to GAAP earnings. MORRISTOWN, N.J., March 4, 2010 /PRNewswire via COMTEX/ -- Watson Pharmaceuticals, Inc. (NYSE: WPI) today announced an agreement to expand their Women's Health brand product portfolio with the acquisition of the exclusive U.S. rights to Columbia Laboratories, Inc.'s bioadhesive progesterone gel products currently marketed under the trade names CRINONE(R) and PROCHIEVE(R) for the indications of infertility and secondary amenorrhea. The two companies will collaborate in the ongoing Phase 3 development program toward a new indication for these products for the prevention of preterm birth in women with a short cervix, as well as a global development program for second-generation products for this indication and infertility. Watson will also acquire 11.2 million shares of Columbia common stock. INDUSTRY Growth The 45.84 billion Generic Pharmaceutical and Medicine Manufacturing industry continues to outpace growth in the Brand Name Pharmaceutical and Medicine manufacturing industry. During the next 5 years the average annual rate is expected to grow at 6.1% and revenue growth is expected to grow at 7.5%. Growth overseas is rising, and with new emerging markets popping up we can expect the use of generic drugs to increase as new regions gain access to cheaper drugs. 4 Watson Pharmaceuticals Inc. University of Oregon investment group http://uoig.uoregon.edu Federal Funding / Legislative Compliance Requirements Medicare is a program that provides free or subsidized medical and health-related services. Medicare covers almost everyone 65 or older as well as people on Social Security disability. The Congressional Budget Office projects that the funding for Medicare and Medicaid will rise 5.37% per year to surpass a trillion dollars by 2015. From the most recent census projections we can expect that the Medicare program is supposed to grow from 40.1 million to 46.6 million in 2015. As of right now more than 90% of seniors and 58% of nonelderly adults rely on a prescription on a regular basis. From these numbers we can expect that more consumers would gain prescription drug coverage and while the margins might be cut down from the new healthcare reform, the increase in demand for prescription drugs will offset the negative change in margins. New Opportunities There are many new opportunities that are available to companies in the generic drug segment, one opportunity come from penetrating emerging markets. Along with this are the new changes in biosimilars (generic versions of biologic drugs which are drugs produced with a living organism) we can expect the generic drug market to enter into this market. In emerging markets, such as Eastern Europe, Asia and Latin America where consumers pay out of pocket leaves a great opportunity for generic drugs. Since they pay out of pocket they are constantly looking for high-quality prescriptions with a low cost, which is something Watson will be able to provide for the future. Mylan a comparable company has in Asia increased from less than .5% of total sales in 2006 to about 13.0% in 2010. As you can see there is room for tremendous growth and with the recent acquisition of Arrow, Watson will be able to achieve this. Including these new opportunities we can expect great things coming from the new patent cliff in 2010-2011. Lipitor and Plavix are both expected to lose patent protection in 2011 as the Brand Name. S.W.O.T. ANALYSIS Strengths With high cash positions, barriers of entry will become lower as Watson will be able to acquire smaller companies allowing Watson to grow. In 2011 and beyond, the generic wave will continue. Lipitor and Plavix are both expected to lose patent protection. An estimated of 142 billion in current sales will lose patent protection over the next five years. 5 Watson Pharmaceuticals Inc. University of Oregon investment group http://uoig.uoregon.edu Profit margin as a percentage of revenue is expected to decrease only slightly to 14.7% in 2015, versus 14.9% in 2011. In early 2010, the Patient Protection and Affordable Care Act was signed. This healthcare reform is expected to benefit generic pharmaceutical and medicine manufacturers for the most part. Weaknesses In the generic brands segment entry can be difficult as they have to wait for patents to expire, and then gain approval of the FDA. The increased costs associated with the legislation will be manageable for most firms without causing material damage to their profits. Opportunities Opportunities exist to introduce off-patent or generic counterparts of the brand products. Capitalization on emerging markets such as Central and Eastern Europe, Turkey, Japan and South Africa. New changes within the structure of biosimilars. Threats The congress has proposed significant reforms to the U.S health care system. We are unaware how this will affect the healthcare segment, and what affect it will have on their margins. With the new healthcare reform we can expect more penetration within the segment, therefore decreasing are margins. Numbers of companies in the next five years to 2015 are expected to increase by 1,138 representing an average annual growth rate of 1.4%. PORTER’S 5 FORCES ANALYSIS Supplier Power In the generic market they are already competing in the pricing market, so the ability to change the prices along the line can often be hard. The effects of increasing the cost of a generic drug would drastically change the amount of drugs bought do to the fact that people looking for generic drugs are looking for a cheaper alternative to brand names. Barriers to Entry 6 Watson Pharmaceuticals Inc. University of Oregon investment group http://uoig.uoregon.edu There are many barriers of entry in this market as the top for players only account for 36.5% of the total sales. In this market large size does not offer the same level of advantages to generic manufacture as brand names do. Generic firms can be smaller because the cost of research and development is significantly lower. There are supposed to be many more companies to enter the market within the next couple of year but the larger companies are going to be able to acquisition smaller companies. Generic drugs do not have a defense of a patent so therefore the barriers to entry are increasing. With the new entrants they must compete with more established and more sizeable companies. Buyer Power There is very little buyer power in the market because everything that goes into COGS must be inspected by the Food and Drug Administration. To become one of these facilities can take quite some time so there are little suppliers to the companies producing drugs. Threat of Substitutes The threats of substitutes are very little since the generic drugs are the substitutes. There is a problem with brand name drug companies coming into the market. Such companies as Pfizer have started to take an interest in the Generic Drug segment. With increased drug companies that have been around coming into the market will cause margins to drop as it becomes more competitive. Degree of Rivalry Competition in the Generic Pharmaceutical & Medicine Manufacturing industry is growing at a fast rate. Competition in the U.S market continues to increase as more companies are becoming increasingly aware of how fast the generic market is growing. There are many drugs that plan to go off patent during the patent cliff, and we can expect more companies to enter the market as well as already sustained companies to get more aggressive. COMPARABLES ANALYSIS I chose my companies based on their business segment, as companies within the pharmaceutical segment will be facing the same risk and rewards going into the future. Other things I took into consideration consist of companies that had a similar future growth, and how aggressive these companies are with their acquisitions. Along the same lines I looked at companies with similar beta’s, global presence, and infrastructure. I found four companies that fit these criteria: Mylan, Inc., Teva Pharmaceutical Industries, Forest Laboratories, Inc., and Abbott Laboratories. 7 Watson Pharmaceuticals Inc. University of Oregon investment group http://uoig.uoregon.edu Mylan, Inc. – MYL (30%) “Mylan Inc. and its subsidiaries engage in the development, manufacture, marketing, licensing, and distribution of generic and branded generic pharmaceuticals, specialty pharmaceuticals, and active pharmaceutical ingredients (APIs) worldwide. It operates in two segments, Generics and Specialty. The Generics segment offers generic or branded generic pharmaceutical products in tablet, capsule, or transdermal patch form, as well as APIs. This segment markets its products for the proprietary and ethical pharmaceutical wholesalers and distributors, drug store chains, drug manufacturers, institutions, and public and governmental agencies located primarily in the United States and Canada, Europe, the Middle East, Africa, Australia, Japan, India, and New Zealand." ~ Yahoo!/Finance Similar to Watson, Mylan is expected to growing at a high percentage for the next three years. On FactSet in the fiscal year of 2011 they are expected to be growing at a 13.5% rate for their EBITDA which is very comparable to Watsons 12.2%. Along these lines they also have a very similar beta, and also have global presence. This will make them a very good comparable company as they will have the same risk in the states as well as overseas. Another thing to mention is they are heavily invested into generic drugs, and as I feel generics will be more prominent in the future as we can expect them to face the same growth as well as struggles. Mylan’s extreme comparability to Watson made me weight them at 30% due to their similar business strategies. Teva Pharmaceutical Industries Limited – TEVA (30%) “Teva Pharmaceutical Industries Limited engages in the development, production, and sale of a range of generic and branded pharmaceuticals, biogenerics, and active pharmaceutical ingredients (APIs) worldwide. The company’s principal products include Copaxone for multiple sclerosis; and Azilect for Parkinson’s disease. Teva Pharmaceutical also provides specialty pharmaceutical products, which include respiratory products based on its proprietary delivery systems, including Easi-Breathe, an advanced breath-activated inhaler; Spiromax/Airmax, a multidose dry powder inhaler; Steri-Nebs, the blow-fill-seal based nebulizers; and Cyclohaler, a single dose dry powder device.” ~ Yahoo!/Finance Teva is very comparable to Watson, its revenues come mainly from the U.S but it also has a lot of global presence. It plans to expand through acquisitions and like Watson has had many acquisitions in last couple of years. They are growing around the same percentage for their top line revenue as well as EBITDA. Also regarding beta, and gross margin they are very similar. Along the lines they also have their hand in both the generic segment as well as the brand segment. I chose to weight TEVA at 30% because like MYL they are very comparable companies in many different ways. Forrest Laboratories – FRX (20%) “Forest Laboratories, Inc. develops, manufactures, and sells branded and generic forms of ethical drug products. Its principal products include Lexapro to treat depression; Namenda to treat Alzheimer's 8 Watson Pharmaceuticals Inc. University of Oregon investment group http://uoig.uoregon.edu disease; Bystolic, beta-blocker to treat hypertension; and Savella for the treatment of fibromyalgia. The company also provides Sudocrem, a topical preparation to treat diaper rash; Colomycin, an antibiotic to treat cystic fibrosis; Infacol, which is used to treat infant colic; and Exorex, which is to treat eczema and psoriasis.” ~ Yahoo!/Finance The reasoning for choosing Forrest Laboratories is the have a very similar beta, they have relatively close margins, and they are going to be faced with the same business risk going into the future. They are also growing at the same percentage that the generic drugs market is supposed to be growing. Forrest Laboratories has also made some recent acquisitions, and also states in their most recent conference call they expect to grow through acquisitions. I chose to weight FRX at 20% because while they are very similar to Watson I felt the two companies chosen above had an edge on how comparable they were. Abbott Laboratories – ABT (20%) “Abbott Laboratories engages in the discovery, development, manufacture, and sale of health care products worldwide. It operates in four segments: Pharmaceutical Products, Diagnostic Products, Nutritional Products, and Vascular Products. The Pharmaceutical Products segment offers adult and pediatric pharmaceuticals for rheumatoid arthritis, psoriatic arthritis, ankylosing spondylitis, psoriasis, Crohn's disease, dyslipidemia, HIV infection, hypothyroidism, advanced prostate cancer, endometriosis and central precocious puberty, anemia, obesity, epilepsy and bipolar disorder, migraines, secondary hyperparathyroidism, gastroesophageal reflux disease, duodenal and gastric ulcers, and erosive esophagitis, as well as provides anesthesia products and antiinfectives.” ~ Yahoo!/Finance Abbot was a good choice for a comparable company because they sell products worldwide. This company was a good choice because they to as well as Watson have a segment that is involved in the distribution of drugs. They also offer next day delivery, as well as many other services for drugs. Another key part to this company is they plan to invest more in R&D and this is similar to Watson as they want to grow their brand products while also keeping their generics in line. I chose to weight abbot at 20% because they are very similar but had some differences in margins and beta. Valuation Multiples EV/Revenue, EV/Gross Profit, EV/EBITDA, and EV/OCF were all used to find the implied price of Watson Pharmaceuticals. Each was evenly waited as there were no significant differences in the metrics. EV/Gross Profit gives an indication on how well the firms’ pure revenue performance compared to how the market is pricing. EV/EBITDA was used to determine how the company is performing without taking into account the companies expenses and depreciation. I used EV/Revenue to be a good measure of how the market is pricing a company based off its revenue. Lastly I used EV/OCF takes into account the actual cash that flows into and out of the company. Unlike EV/Net Revenue which can be affected by different accounting principles, EV/OCF is a better indicator of the company’s financial health. I weighted all of these metrics the same as there was no reason to weight one more than the other. 9 Watson Pharmaceuticals Inc. University of Oregon investment group http://uoig.uoregon.edu DISCOUNTED CASH FLOW ANALYSIS For the discounted cash flow analysis of Watson Pharmaceuticals Inc. I chose to use a percentage of revenue method. I broke down their company into 4 segments, Generic, Brand, Distribution, and Other Revenue. For my revenue projections I relied heavily on company guidance, and also IBISWorld report on the growing industry of the Generic market. When calculating my discounted cash flow, I discounted the free cash flows to calculate the net present value of the company, and used the diluted shares outstanding in order to find the implied price of the company. I used my normal WACC in order to discount their free cash flows. When calculating my PV of Terminal Value and Terminal Value I used a terminal WACC that uses the 30 year Treasury bond. This is a more accurate projection of what the implied price will be due to the fact that the 10 year Treasury bond is so low. Revenue The revenue model was built through forecasting the growth of WPI’s four segments. I used a lot of company guidance as well as information provided by IBISWorld in order to project future revenues. The company is growing rapidly and also plans to make a substantial amount of acquisitions. Cost of Goods Sold The COGS margin for generics increased until the year through the mid-1990s, and since then, there has been a gradual decline. During the past five years, generic companies have been able to reduce costs through consolidation and sourcing raw materials from global suppliers. Depreciation Depreciation has historically been fairly constant as a percent of revenue, and was projected to only slightly increase going forward as the company plans to invest more into plants and equipment. Selling and Marketing Expenses Were projected as percentage of revenue, but I do have it slightly increasing within the next couple of years as they are expected to increase their marketing expenses as they have recently gone overseas. This will allow them to capitalize on the generic market overseas as they gain more sustainability and recognition. Taxes The higher tax rate year ended for December 31, 2009 was primarily due to the impact of the non-recurring tax benefits which occurred in 2008. The tax rate for the company is expected to lower within the next couple years due to non-recurring tax benefits associated with the Arrow Acquisition. The six months ended in June 30th, 2010 was 31.5% and is expected to be at 32% for the fiscal year ending. This is expected to stay constant for a couple years then tread back up to a more realistic historical average. Working Capital The company has given little indication that significant changes in its working capital will take place. Because of this I projected current assets and current liabilities based off their historical percentages of revenue. 10 Watson Pharmaceuticals Inc. University of Oregon investment group http://uoig.uoregon.edu Acquisitions Companies in the healthcare sector gain a lot of growth through acquisitions. In the last couple of years Watson has made multiple acquisitions and is going to continue to grow through acquisitions. I put their acquisitions as a percentage of revenue and tried to tread it higher in order to properly project the acquisitions they might make in the future. Beta I used many methods to determine if there was a correct beta, I ran a 5 year monthly, 2 year weekly, and 1 year weekly. They all came out with betas around .5 (+/- .05), which I felt was not a great projection of what the beta is, especially if my comparable companies all have higher betas. I chose to run a Vasicek beta test where I came out with a beta of .74. I felt this was a more accurate representation of how volatile my company was to the sector. RECOMMENDATION Watson Pharmaceutical Inc. is a growing company and based on the implied price from my DCF analysis and my comparable analysis I arrived at a final price of 53.90. This represents a current undervaluation of 16%. With the new changes in the healthcare reform and the substantial amount of consumers or companies that will be going to generic drugs as supplements for brand name drugs, we can expect a very promising future for Watson. Watson is an exceptional company with a lot of growth potential, and with a driving management team that has been around for years. We can also expect Watson to grow internationally and penetrate markets that have not been touched. I am recommending a BUY for all portfolios due to the undervaluation given by my discounted cash flow and comparable analysis. Price Comparables Implied Price DCF Implied Price Weighted Implied Price Current Price Undervalued Weighting 50.66 50% 57.13 50% 53.90 100% 46.65 16% 11 Watson Pharmaceuticals Inc. University of Oregon investment group http://uoig.uoregon.edu APPENDIX 1 – COMPARABLES ANALYSIS The University of Oregon Investment Group 30.00% ($ in millions, except per share data) Stock Characteristics Current Price 50 Day Moving Avg. 200 Day Moving Avg. Beta Size ST Debt LT Debt Cash and Cash Equiv. Diluted Share Count Market Cap Enterprise Value Profitability Margins Gross Margin EBIT Margin EBITDA Margin Net Margin Credit Metrics Interest Expense (MRQ) Debt/Equity (MRQ) Debt/EBITDA (LTM) EBITDA/Interest Expense (LTM) Operating Results Revenue (FLM) Gross Profit (FLM) EBITDA (FLM) Free Cash Flow (FLM) EV/Revenue EV/Gross Profit EV/EBITDA EV/Free Cash Flow WPI TEVA 30.00% MYL 20.00% 20.00% FRX ABT Weighted Average Max 54.70 53.23 54.73 0.71 Min 20.32 18.24 19.08 0.50 Avg. 39.85 38.65 38.03 0.64 Median 42.19 41.57 39.15 0.68 46.65 44.11 42.94 0.74 54.70 53.23 54.73 0.67 20.32 18.24 19.08 0.71 33.05 31.11 28.41 0.69 51.32 52.02 49.88 0.5 39.38 38.07 37.80 0.65 8,182 12,612 4,854 1,552 79,638 89,544 610 301 6,389 8,225 2,487 6,366 2,877 772 36,588 42,564 883 6,426 3,022 618 30,163 36,244 85 1,159 225 124 5,771 6,789 8,182 7,640 4,854 921 50,379 61,347 151 5,212 610 314 6,389 11,142 1,723 301 9,948 8,225 1615 12612 4321 1551.8 79,638 89,544 2,822.90 6,378.00 2,848.00 741.18 34,947.52 41,300.42 57.05% 24.20% 29.03% 15.10% 55.60% 22.45% 29.25% 16.55% 44.00% 17.30% 23.80% 7.90% 53.00% 20.90% 28.60% 14.40% 40.70% 21.70% 24.70% 1.80% 76.30% 31.00% 32.90% 25.50% 58.20% 23.20% 29.90% 18.70% 267.05 0.28 1.35 13.95 274.25 0.16 1.13 13.69 34.2 20% 1.24 27.26 230 15% 1.17 28.43 318.5 82% 3.14 5.21 0.00 0% 0.00 0.00 519.7 16% 1.09 22.17 268.49 0.32 1.51 14.52 3,518.1 1,764.0 932.4 499.7 1.93 x 3.85 x 7.28 x 13.59 x 18,725.0 10,872.0 6,538.2 4052.2 3.28 x 5.64 x 9.38 x 15.14 x 6,045.9 2,873.8 1,659.0 877.7 1.84 x 3.88 x 6.72 x 12.69 x 4,539.4 3,481.2 1,544.8 1189.3 1.81 x 2.36 x 5.32 x 6.92 x 38,179 23,024 11,520 7,694 2.35 x 3.89 x 7.77 x 11.64 x 9,770.10 5,742.33 3,247.33 2,039.73 2.37 x 4.11 x 7.45 x 12.06 x 76.30% 40.70% 31.00% 20.90% 32.90% 24.70% 25.50% 1.80% 519.70 0.82 3.14 28.43 38,179 23,024 11,520 7,694 N/A N/A N/A N/A 4,539 2,874 1,545 878 16,872 10,063 5,315 3,453 12,385 7,177 4,099 2,621 Metric EV/Revenue EV/Gross Profit EV/EBITDA EV/OCF Implied Price 59.78 49.19 46.78 46.90 55% 24% 29% 14% Weight 25.00% 25.00% 25.00% 25.00% 12 Price Target Current Price Under (Over) Valued 50.66 46.65 8.6% Watson Pharmaceuticals Inc. University of Oregon investment group http://uoig.uoregon.edu APPENDIX 2 – DISCOUNTED CASH FLOWS ANALYSIS The University of Oregon Investment Group ($ in millions, except per share data) Total Company Revenue % Y/Y Growth Cost of Revenue % Revenue Gross Profit Gross Margin Selling and marketing expenses % Revenue General and administrative expeses % Revenue R&D % Revenue Amortization % Revenue Loss (gain) on asset sales and impairments % Revenue Total Operating Expenses % Revenue EBIT % Revenue Other (Expense) Income % Revenue Pre-tax Income % Revenue Less Taxes (Benefit) Tax Rate Net Income Net Margin Add Back Depreciation and Ammortization % Revenue Add Back Interest Expense*(1-Tax Rate) Operating Cash Flow % Revenue Current Assets % Revenue Current Liabilities % Revenue Net Working Capital % Revenue Change in Net Working Capital Capital Expenditures % Revenue Acquistions % Revenue Unlevered Free Cash Flow Discounted Unlevered Free Cash Flows 2007 2496.70 26.2% 1504.80 60.3% 991.90 39.7% 215.40 8.6% 205.70 8.2% 144.80 5.8% 176.40 7.1% 6.10 0.2% 2241.00 89.8% 255.70 10.2% -31.50 0% 224.20 9% 83.20 37% 141.00 6% 253.60 10% 19.81 414.41 17% 1173.78 47% 444.93 18% 728.85 29% 157.10 84.30 3% 0.00 0% 173.01 2008 2535.50 1.6% 1502.80 59.3% 1032.70 40.7% 232.90 9.2% 190.50 7.5% 170.10 6.7% 80.70 3.2% 0.30 0.0% 2177.30 85.9% 358.20 14.1% 0.10 0% 358.30 14% 119.90 33% 238.40 9% 170.70 7% 0.07 409.17 16% 1458.40 58% 482.00 19% 976.40 39% 247.55 108.70 4% 0.00 0% 52.92 0.5 2009 2010 Q12 A 2010Q34E 2793.00 1731.80 1866.20 10.2% ~ ~ 1596.80 1002.70 1002.62 57.2% 57.9% 53.7% 1196.20 729.10 863.58 42.8% 42.1% 46.3% 263.10 158.30 158.33 9.4% 9.1% 8.5% 257.10 150.30 152.26 9.2% 8.7% 8.2% 197.30 121.30 160.15 7.1% 7.0% 8.6% 92.60 82.10 76.21 3.3% 4.7% 4.1% 2.20 1.10 -1.10 0.1% 0.1% -0.1% 2409.10 1515.80 1548.47 86.3% 87.5% 83.0% 383.90 216.00 237.83 13.7% 12.5% 12.7% -21.30 -11.00 14.52 0% 0% 0% 362.60 205.00 252.35 13% 12% 14% 140.60 64.60 81.75 39% 32% 32% 222.00 140.40 170.60 8% 8% 9% 189.00 133.40 142.42 7% 8% 8% 13.04 7.53 -5.14 424.04 281.33 307.88 15% 16% 16% 1771.00 1757.10 2278.89 63% 101% 122% 1052.40 754.20 922.23 38% 44% 49% 718.60 1002.90 1356.66 26% 58% -19% -257.80 284.30 353.76 79.90 23.60 81.94 3% 1% 2% 968.20 0.00 123.13 35% 0% 4% -366.26 -26.57 33.34 32.07 2010 AE 3518.10 26.0% 2005.32 57.0% 1512.78 43.0% 316.63 9.0% 302.56 8.6% 281.45 8.0% 158.31 4.5% 0.00 0.0% 3064.27 87.1% 453.83 12.9% 3.52 0% 457.35 13% 146.35 32% 311.00 9% 275.82 8% 2.39 589.21 17% 2278.89 65% 922.23 26% 1356.66 39% 353.76 105.54 3% 123.13 4% 6.77 1.5 2011 E 3946.23 12.2% 2249.35 57.0% 1696.88 43.0% 355.16 9.0% 343.32 8.7% 335.43 8.5% 157.85 4.0% 0.00 0.0% 3441.11 87.2% 505.12 12.8% 3.95 0% 509.06 13% 162.90 32% 346.16 9% 303.86 8% 2.68 652.71 17% 2525.59 64% 1018.13 26% 1507.46 38% 150.80 138.12 4% 147.98 4% 215.80 191.99 2.5 2012 E 4385.63 11.1% 2543.67 58.0% 1841.96 42.0% 399.09 9.1% 407.86 9.3% 377.16 8.6% 162.27 3.7% 0.00 0.0% 3890.05 88.7% 495.58 11.3% 4.39 0% 499.96 11% 159.99 32% 339.97 8% 337.69 8% 2.98 680.65 16% 2697.16 62% 1087.64 25% 1609.53 37% 102.07 153.50 4% 164.46 4% 260.62 214.47 3.5 2013 E 4884.07 11.4% 2808.34 57.5% 2075.73 42.5% 459.10 9.4% 439.57 9.0% 390.73 8.0% 170.94 3.5% 0.00 0.0% 4268.67 87.4% 615.39 12.6% 4.88 0% 620.28 13% 201.59 33% 418.69 9% 376.07 8% 3.30 798.06 16% 2954.86 61% 1162.41 24% 1792.45 37% 182.93 170.94 4% 183.15 4% 261.04 198.70 4.5 2014 E 5402.28 10.6% 3079.30 57.0% 2322.98 43.0% 497.01 9.2% 480.80 8.9% 378.16 7.0% 178.28 3.3% 0.00 0.0% 4613.55 85.4% 788.73 14.6% 5.40 0% 794.14 15% 262.06 33% 532.07 10% 415.98 8% 3.62 951.67 18% 3214.36 60% 1285.74 24% 1928.62 36% 136.16 189.08 4% 202.59 4% 423.84 298.42 5.5 2015 E 5919.62 9.6% 3344.58 56.5% 2575.03 43.5% 544.60 9.2% 520.93 8.8% 402.53 6.8% 195.35 3.3% 0.00 0.0% 5008.00 84.6% 911.62 15.4% 5.92 0% 917.54 16% 302.79 33% 614.75 10% 455.81 8% 3.97 1074.53 18% 3522.17 60% 1408.87 24% 2113.30 36% 184.69 207.19 4% 221.99 4% 460.67 300.03 6.5 2016 E 6374.27 7.7% 3601.47 56.5% 2772.81 43.5% 573.68 9.0% 548.19 8.6% 414.33 6.5% 210.35 3.3% 0.00 0.0% 5348.02 83.9% 1026.26 16.1% 6.37 0% 1032.63 16% 340.77 33% 691.86 11% 490.82 8% 4.27 1186.95 19% 3792.69 60% 1517.08 24% 2275.62 36% 162.31 223.10 4% 239.04 4% 562.51 338.87 7.5 2017 E 6817.19 6.9% 3851.71 56.5% 2965.48 43.5% 613.55 9.0% 572.64 8.4% 429.48 6.3% 224.97 3.3% 0.00 0.0% 5692.35 83.5% 1124.84 16.5% 6.82 0% 1131.65 17% 379.10 34% 752.55 11% 511.29 8% 4.53 1268.37 19% 3988.05 59% 1622.49 24% 2365.56 35% 89.95 245.42 4% 255.64 4% 677.36 377.46 8.5 2018 E 7230.18 6.1% 4085.05 56.5% 3145.13 43.5% 636.26 8.8% 614.57 8.5% 448.27 6.2% 238.60 3.3% 0.00 0.0% 6022.74 83.3% 1207.44 16.7% 7.23 0% 1214.67 17% 406.91 34% 807.76 11% 542.26 8% 4.81 1354.83 19% 4157.35 58% 1720.78 24% 2436.57 34% 71.01 260.29 4% 271.13 4% 752.40 387.83 9.5 2019 E 7663.47 6.0% 4329.86 56.5% 3333.61 43.5% 628.40 8.2% 636.07 8.3% 452.14 5.9% 252.89 3.3% 0.00 0.0% 6299.38 82.2% 1364.10 17.8% 7.66 0% 1371.76 18% 459.54 34% 912.22 12% 574.76 8% 5.10 1492.08 19% 4406.50 58% 1823.91 24% 2582.59 34% 146.02 275.89 4% 306.54 4% 763.64 364.10 13 Watson Pharmaceuticals Inc. University of Oregon investment group http://uoig.uoregon.edu APPENDIX 3 – DISCOUNTED CASH FLOWS ANALYSIS ASSUMPTIONS Assumptions for Discounted Free Cash Flows Model Tax Rate 33.50% Terminal Growth Rate Risk-Free Rate 2.62% Terminal Value Terminal Risk-Free Rate 3.91% PV of Terminal Value Beta 0.74 Sum of PV Free Cash Flows Market Risk Premium 7.00% Firm Value % Equity 83.28% LT Debt % Debt 16.72% Cash Cost of Debt 5.56% Equity Value CAPM 7.79% Diluted Share Count Terminal CAPM 9.08% Implied Price WACC 8.11% Current Price Terminal WACC 9.18% Under (Over) Valued 3.00% 12721.4 5521.6 2703.9 8225.6 1158.5 224.8 7067.1 123.7 57.13 46.65 22.47% APPENDIX 4 – BETA SENSITIVITY ANALYSIS Beta 0.86 0.83 0.8 0.77 0.74 0.710 0.680 0.650 0.620 St. Deviation Implied Price Under (Over) Valued 2.00 49.99 6.91% 1.50 51.78 10.74% 1.00 53.66 14.76% 0.50 55.66 19.03% 0.00 53.90 15.27% -0.50 60.00 28.31% -1.00 62.37 33.38% -1.50 64.89 38.77% -2.00 67.57 44.50% 14 Watson Pharmaceuticals Inc. University of Oregon investment group http://uoig.uoregon.edu APPENDIX 6 – WORKING CAPITAL MODEL The University of Oregon Investment Group ($ in millions, except per share data) Net Revenues Current Assets Cash and Cash Equivalents % of Revenues A/R % of Revenues Prepaid Expenses and Other Current Assets % of Revenues Deferred Tax Assets % of Revenues Inventories,net % of Revenues Marketable securities % of Revenues Total Current Assets % of Revenues Current Liabilities A/P % of Revenues Income taxes payable % of Revenues Short-term debt and current portion of long-term debt % of Revenues Deferred tax liabilities % of Revenues Deferred Revenue % of Revenues Total Current Liabilities % of Revenues 2007 2496.7 2008 2535.5 2009 2010 Q12A 2010Q34E 2793 1730.9 1866.2 204.6 8.2% 267.1 11% 86.1 3% 113.6 5% 490.6 20% 11.80 0.5% 1173.8 47% 507.6 20.0% 305.0 12% 48.5 2% 111.0 4% 473.1 19% 13.20 0.5% 1458.4 58% 201.4 7.2% 519.5 19% 213.3 8% 130.9 5% 692.3 25% 13.60 0.5% 1771.0 63% 398.154 15.9% 0.00 0.0% 6.42 0.3% 18.78 0.8% 21.75 0.9% 445.11 18% 381.328 15.0% 15.50 0.6% 53.20 2.1% 15.84 0.6% 16.10 0.6% 481.97 19% 615.2 22.0% 78.40 2.8% 307.60 11.0% 34.90 1.2% 16.30 0.6% 1052.40 38% 2011 E 3518.1 2012 E 3946.23 2013 E 4385.63 2014 E 4884.07 2015 E 5402.28 2016 E 5919.62 2017 E 6374.27 2018 E 6817.19 2019 E 7230.18 2020 E 7663.47 224.8 13.0% 502.1 29% 183.8 11% 135.8 8% 699.3 40% 11.30 0.7% 1757.1 102% 422.172 12% 484.6583 14% 281.448 8% 246.267 7.0% 844.34 24% 0.00 0% 2278.9 65% 513.0097 13% 552.472 14% 315.6983 8% 236.7737 6.0% 907.63 23% 0.00 0% 2525.6 64% 570.1319 13% 613.9882 14% 394.7067 9% 241.2097 5.5% 877.13 20% 0.00 0% 2697.2 62% 683.7692 14% 683.7692 14% 341.8846 7% 268.6236 5.5% 976.81 20% 0.00 0% 2954.9 61% 756.3198 14% 756.3198 14% 324.137 6% 297.1256 5.5% 1080.46 20% 0.00 0% 3214.4 60% 828.7463 14% 828.7463 14% 355.177 6% 325.5789 5.5% 1183.92 20% 0.00 0% 3522.2 60% 892.3985 14% 892.3985 14% 382.4565 6% 350.5851 5.5% 1274.85 20% 0.00 0% 3792.7 60% 886.2344 13% 954.4062 14% 409.0312 6% 374.9453 5.5% 1363.44 20% 0.00 0% 3988.1 59% 867.6219 12% 1012.226 14% 433.811 6% 397.66 5.5% 1446.04 20% 0.00 0% 4157.4 58% 919.6169 12% 1072.886 14% 459.8084 6% 421.4911 5.5% 1532.69 20% 0.00 0% 4406.5 58% 592.7 34.2% 20.90 1.2% 85.00 4.9% 35.6 2.1% 20.00 1.2% 754.20 44% 767.4345 22% 35.18 1% 91.47 3% 28.1448 1% 0.00 0.0% 922.23 26% 868.1702 22% 39.46 1% 78.92 2% 31.56983 1% 0.00 0.0% 1018.13 26% 964.8386 22% 43.86 1% 43.86 1% 35.08504 1% 0.00 0.0% 1087.64 25% 1074.494 22% 48.84 1% 0.00 0% 39.07252 1% 0.00 0.0% 1162.41 24% 1188.502 22% 54.02 1% 0.00 0% 43.21827 1% 0.00 0.0% 1285.74 24% 1302.316 22% 59.20 1% 0.00 0% 47.35693 1% 0.00 0.0% 1408.87 24% 1402.34 22% 63.74 1% 0.00 0% 50.9942 1% 0.00 0.0% 1517.08 24% 1499.781 22% 68.17 1% 0.00 0% 54.5375 1% 0.00 0.0% 1622.49 24% 1590.64 22% 72.30 1% 0.00 0% 57.84146 1% 0.00 0.0% 1720.78 24% 1685.964 22% 76.63 1% 0.00 0% 61.30779 1% 0.00 0.0% 1823.91 24% 15 Watson Pharmaceuticals Inc. University of Oregon investment group http://uoig.uoregon.edu APPENDIX 6 – REVENUE MODEL The University of Oregon Investment Group Revenue Model 2007 2008 2009 1408.9 -6% 375.2 6% 566.1 510% 146.5 373% 2496.7 26.2% 1404 -0.35% 397 5.81% 606.2 7.08% 128.3 -12.42% 2535.5 1.55% 1641.8 16.94% 393.7 -0.83% 663.8 9.50% 93.7 -26.97% 2793 10.16% 2010Q12A 2010Q34E 2010 A+E 2012 2013 2014 2015 2016 2017 2018 2019 2020 2503.901 2829.40813 3197.23119 3580.89893 3956.89332 4273.44478 14.7% 13.0% 13.0% 12.0% 10.5% 8.0% 465.1548 497.715636 530.564868 565.051584 600.649834 636.688824 7.60% 7.00% 6.60% 6.50% 6.30% 6.00% 856.958 934.08422 1027.49264 1123.04946 1224.12391 1322.05382 9.0% 9.0% 10.0% 9.3% 9.0% 8.0% 120.2146 124.422111 128.776885 133.284076 137.949019 142.087489 3.1% 3.5% 3.5% 3.5% 3.5% 3.0% 3946.2284 4385.6301 4884.06558 5402.28405 5919.61608 6374.27492 12.17% 11.13% 11.37% 10.61% 9.58% 7.68% 4572.58592 7.0% 670.433332 5.30% 1427.81813 8.0% 146.350114 3.0% 6817.18749 6.95% 4860.65883 6.3% 705.295865 5.20% 1513.48721 6.0% 150.740617 3.0% 7230.18253 6.06% 5166.88034 6.3% 737.034179 4.50% 1604.29645 6.0% 155.262836 3.0% 7663.4738 5.99% ($ In millions, except per share data) Generic Revenue YoY % growth Brand YoY % growth Distribution YoY % growth Other YoY % growth Total Revenue % Growth 1094 ~ 1168 ~ 149.3 ~ 283 ~ 422.2 364 ~ ~ 65.4 ~ 1730.9 51.2 ~ 1866.2 2183 32.96% 432.3 9.80% 786.2 18.44% 116.6 24.44% 3518.1 25.96% 16 Watson Pharmaceuticals Inc. University of Oregon investment group http://uoig.uoregon.edu APPENDIX 7 – SOURCES S&P Net Advantage FactSet Comparable Companies 10k’s Yahoo! Finance IBISWorld Sec.gov Healthcare.gov Watson.com Watson Pharmaceutical Inc. 10-k Whitehouse.gov/healthreform 17
