Tuesday Jan 28
advertisement
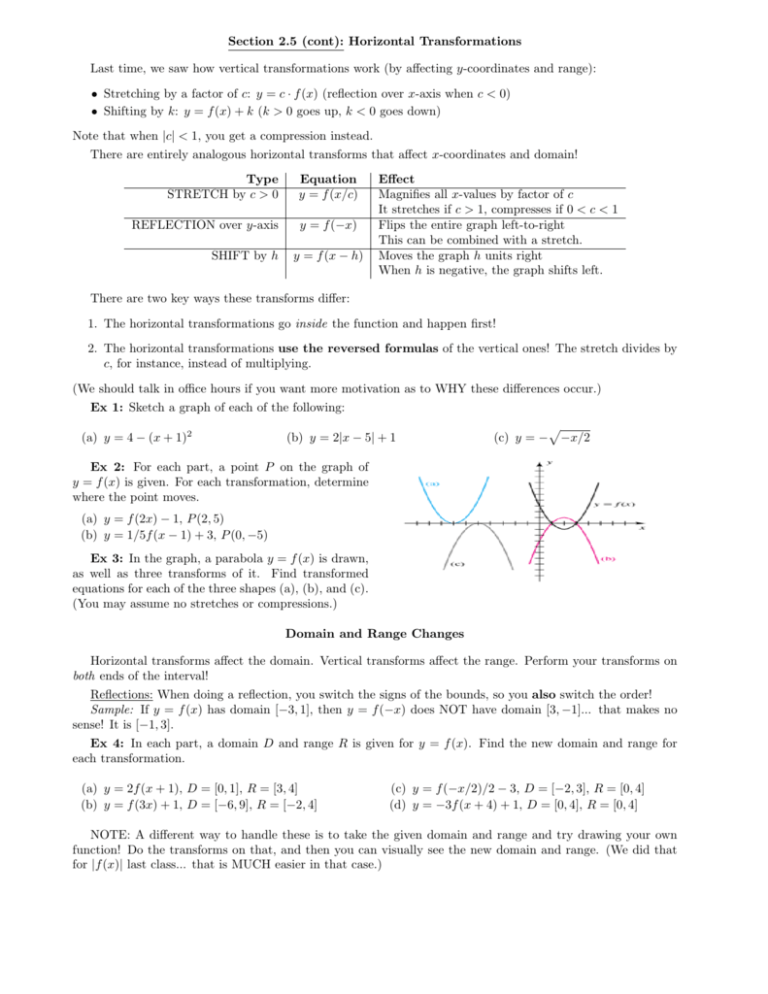
Section 2.5 (cont): Horizontal Transformations Last time, we saw how vertical transformations work (by affecting y-coordinates and range): • Stretching by a factor of c: y = c · f (x) (reflection over x-axis when c < 0) • Shifting by k: y = f (x) + k (k > 0 goes up, k < 0 goes down) Note that when |c| < 1, you get a compression instead. There are entirely analogous horizontal transforms that affect x-coordinates and domain! Type STRETCH by c > 0 Equation y = f (x/c) REFLECTION over y-axis y = f (−x) SHIFT by h y = f (x − h) Effect Magnifies all x-values by factor of c It stretches if c > 1, compresses if 0 < c < 1 Flips the entire graph left-to-right This can be combined with a stretch. Moves the graph h units right When h is negative, the graph shifts left. There are two key ways these transforms differ: 1. The horizontal transformations go inside the function and happen first! 2. The horizontal transformations use the reversed formulas of the vertical ones! The stretch divides by c, for instance, instead of multiplying. (We should talk in office hours if you want more motivation as to WHY these differences occur.) Ex 1: Sketch a graph of each of the following: (a) y = 4 − (x + 1)2 (b) y = 2|x − 5| + 1 (c) y = − p −x/2 Ex 2: For each part, a point P on the graph of y = f (x) is given. For each transformation, determine where the point moves. (a) y = f (2x) − 1, P (2, 5) (b) y = 1/5f (x − 1) + 3, P (0, −5) Ex 3: In the graph, a parabola y = f (x) is drawn, as well as three transforms of it. Find transformed equations for each of the three shapes (a), (b), and (c). (You may assume no stretches or compressions.) Domain and Range Changes Horizontal transforms affect the domain. Vertical transforms affect the range. Perform your transforms on both ends of the interval! Reflections: When doing a reflection, you switch the signs of the bounds, so you also switch the order! Sample: If y = f (x) has domain [−3, 1], then y = f (−x) does NOT have domain [3, −1]... that makes no sense! It is [−1, 3]. Ex 4: In each part, a domain D and range R is given for y = f (x). Find the new domain and range for each transformation. (a) y = 2f (x + 1), D = [0, 1], R = [3, 4] (b) y = f (3x) + 1, D = [−6, 9], R = [−2, 4] (c) y = f (−x/2)/2 − 3, D = [−2, 3], R = [0, 4] (d) y = −3f (x + 4) + 1, D = [0, 4], R = [0, 4] NOTE: A different way to handle these is to take the given domain and range and try drawing your own function! Do the transforms on that, and then you can visually see the new domain and range. (We did that for |f (x)| last class... that is MUCH easier in that case.) Section 2.6A: Structure of Quadratic Functions A quadratic function has the general form y = ax2 + bx + c where a 6= 0. Its shape is called a parabola. The parabola points up when a > 0 and down when a < 0. To solve a quadratic equation, you usually FIRST get everything to one side, leaving 0 on the other. Next, you can either factor, or you can use the Quadratic Formula: √ −b ± b2 − 4ac 2 ax + bx + c = 0 ⇒ x = 2a NOTE: When solving, if a is negative, I usually multiply −1 to both sides to get a positive a instead. It’s easier to factor, and it really pays to have a positive denominator in the formula, as we’ll see in the next class! Ex 5: Solve the following for x: (b) −x2 = 3 − x (a) (x − 1)(x − 3) = 2 Ex 6: Find the first-quadrant point where the parabola y = x2 + x intersects the line y = 2x + 2. Signs of Parabolas: Find the roots, and note the direction the parabola opens. Think of what sign you get between the roots, and that will tell you what signs you get everywhere else! Sample: The parabola x2 + 2x has roots 0 and 2 (find them yourself). It also opens up, since a > 0. Thus, between the roots, the parabola is negative (it hits its minimum), and the intervals outside the roots are positive. √ Ex 7: Find the domain of g(x) = x2 − 6x + 8. (Confirm this with a graph!) The Discriminant The expression b2 − 4ac in the Quadratic Formula is the discriminant. Its sign is important! b2 − 4ac > 0 ⇒ 2 roots b2 − 4ac = 0 ⇒ 1 roots b2 − 4ac < 0 ⇒ 0 roots Picture: the graph crosses x-axis twice. Picture: the graph is tangent to x-axis (glances it once). Picture: the graph lies on one side of x-axis. Ex 8: How many real roots does 3x2 + 8x + 9 have? Ex 9: For which values of k does the formula kx2 − 6x + 3 have exactly one root? Standard Form of a Quadratic The point (h, k) where the parabola “turns around” is called the vertex of the parabola. When a > 0, the vertex is the bottom of the graph. When a < 0, the vertex is at the top. The standard form for a quadratic with leading coefficient a and vertex (h, k) is y = a(x − h)2 + k (To get this, start with y = ax2 and shift right by h and up by k!) Just like point-slope form for lines, the standard form can often be obtained from word problems: you find the vertex, then solve for a. Ex 10: (a) Find the parabola with vertex (1, 3) which goes through (0, 5). (b) Find the parabola with vertex (0, −9) with x-intercepts −2 and 2. Converting to Standard Form: To convert y = ax2 + bx + c to y = a(x − h)2 + k, you normally complete the square. There’s a much easier way, though, called the Vertex Formula: 1. The vertex x-coordinate is h = −b 2a . 2. Plug x = h back in to get y = k. Ex 11: Find the vertex of each parabola. (a) f (x) = 5 + 3x − x2 (b) g(x) = 2x2 + 9 (c) h(x) = 16x2 − 8x + 5
