Causality Orientations and the Disappearance of the Self
advertisement
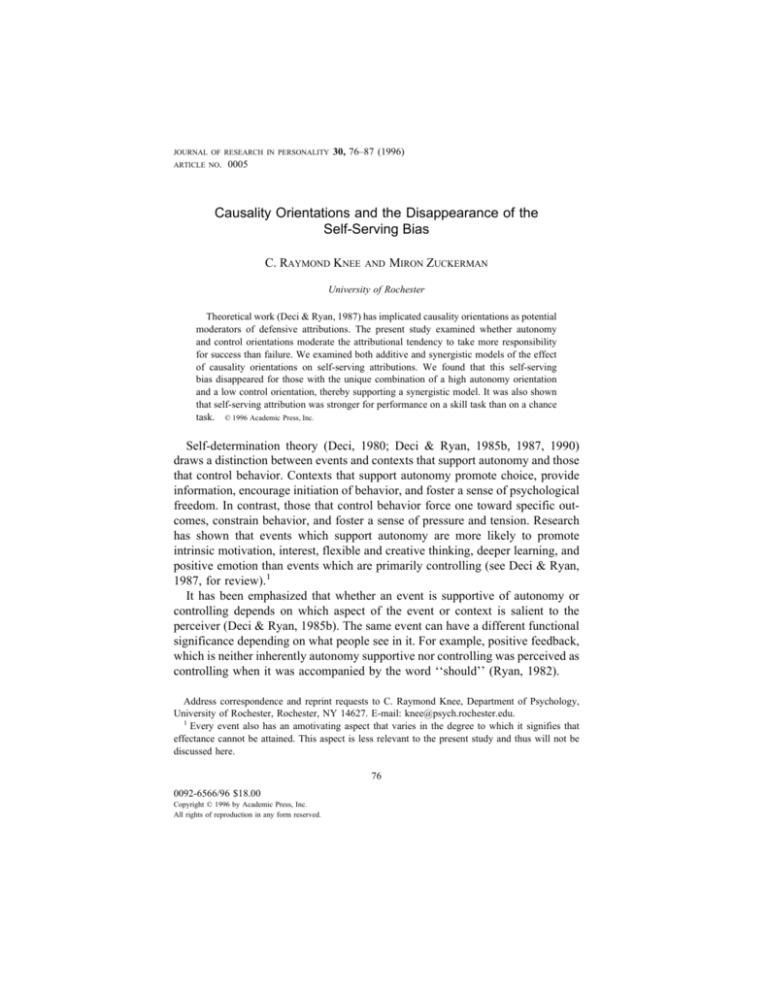
JOURNAL OF RESEARCH IN PERSONALITY ARTICLE NO. 30, 76–87 (1996) 0005 Causality Orientations and the Disappearance of the Self-Serving Bias C. RAYMOND KNEE AND MIRON ZUCKERMAN University of Rochester Theoretical work (Deci & Ryan, 1987) has implicated causality orientations as potential moderators of defensive attributions. The present study examined whether autonomy and control orientations moderate the attributional tendency to take more responsibility for success than failure. We examined both additive and synergistic models of the effect of causality orientations on self-serving attributions. We found that this self-serving bias disappeared for those with the unique combination of a high autonomy orientation and a low control orientation, thereby supporting a synergistic model. It was also shown that self-serving attribution was stronger for performance on a skill task than on a chance task. © 1996 Academic Press, Inc. Self-determination theory (Deci, 1980; Deci & Ryan, 1985b, 1987, 1990) draws a distinction between events and contexts that support autonomy and those that control behavior. Contexts that support autonomy promote choice, provide information, encourage initiation of behavior, and foster a sense of psychological freedom. In contrast, those that control behavior force one toward specific outcomes, constrain behavior, and foster a sense of pressure and tension. Research has shown that events which support autonomy are more likely to promote intrinsic motivation, interest, flexible and creative thinking, deeper learning, and positive emotion than events which are primarily controlling (see Deci & Ryan, 1987, for review).1 It has been emphasized that whether an event is supportive of autonomy or controlling depends on which aspect of the event or context is salient to the perceiver (Deci & Ryan, 1985b). The same event can have a different functional significance depending on what people see in it. For example, positive feedback, which is neither inherently autonomy supportive nor controlling was perceived as controlling when it was accompanied by the word ‘‘should’’ (Ryan, 1982). Address correspondence and reprint requests to C. Raymond Knee, Department of Psychology, University of Rochester, Rochester, NY 14627. E-mail: knee@psych.rochester.edu. 1 Every event also has an amotivating aspect that varies in the degree to which it signifies that effectance cannot be attained. This aspect is less relevant to the present study and thus will not be discussed here. 76 0092-6566/96 $18.00 Copyright © 1996 by Academic Press, Inc. All rights of reproduction in any form reserved. CAUSALITY ORIENTATIONS 77 The functional significance of events also depends on the person encountering them. On the assumption that people differ in the extent to which they perceive the environment as fostering autonomy or imposing control, Deci and Ryan (1985a) developed a general measure of causality orientations. For each person the measure yields scores for both autonomy and control orientations.2 The orientations were found to be orthogonal (r 4 .03), implying that the degree to which one generally perceives situations as fostering growth and learning says little about the degree to which one perceives them as imposing pressure and control. The control orientation has been shown to correlate positively with the type-A coronary-prone behavior pattern and public self-consciousness and is associated with the adoption of a pressured, ego-involved stance toward achievement tasks (Deci & Ryan, 1985b). Koestner and Zuckerman (1994) recently demonstrated similarities between autonomy and control causality orientations (Deci & Ryan, 1985b) and Dweck and Leggett’s (1988) distinction between learning goals and performance goals. They found that controlled individuals tend to adopt performance goals and show greater persistence after failure relative to success. Further, this exaggerated persistence appeared to be pressured and reactive in a manner that typically characterizes a state of high ego involvement (Ryan, Koestner, & Deci, 1991). The autonomy orientation has been shown to be positively correlated with ego development, self-esteem, and self-actualization and negatively correlated with self-derogation. Koestner and Zuckerman (1994) described autonomous individuals as viewing unsolved problems as challenges to be mastered rather than as failures that reflect on their ability. They reported evidence that autonomous participants tend to adopt learning goals and display equal levels of motivation after success and failure. In this way, autonomous individuals tend to become task-involved rather than ego-involved, and their behavior on achievement tasks appears to be relatively unaffected by feedback. Drawing from work on achievement motivation, Nicholls (1984) suggested that people working on a task can be ego-involved or task-involved. Egoinvolved individuals are more oriented toward proving their competence. For example, ego-involved participants would select either very easy tasks that guarantee success or very difficult tasks that provide an excuse for failure. Taskinvolved individuals are more oriented toward learning or enjoying the task; they would select moderately difficult tasks that would provide them with better feedback and a higher degree of challenge. Deci and Ryan (1987) emphasized that the importance of Nicholls’ work for self-determination theory is the implication that ego-involved participants behave in a more defensive or selfaggrandizing manner than do task-involved participants. They added that being 2 The GCOS also measures impersonal orientation which corresponds to the amotivating aspect of events, but this dimension was not of primary interest in the present study. 78 KNEE AND ZUCKERMAN controlled leads participants to focus on proving and defending themselves rather than engaging in activities for growth and challenge. A common attributional tendency, the self-serving bias, involves a tendency to take credit for success and deny responsibility for failure (Pyszczynski & Greenberg, 1987; Ross & Fletcher, 1985; Zuckerman, 1979). There has been debate over whether this effect is best represented by a motivational model or an information-processing model (Bradley, 1978; Miller & Ross, 1975) and whether self-serving attributions reflect a desire to present oneself in a favorable manner or to protect one’s private self-image (Bradley, 1978; Miller, 1978; Weary, 1979). The weight of available evidence, however, suggests that the self-serving bias reflects a motivational tendency to protect one’s self-image, rather than one’s public image (Ditto & Lopez, 1992; Greenberg, 1991; Greenberg, Pyszczynski, & Solomon, 1982; Zuckerman, 1979). A small handful of personality variables have been shown to moderate the self-serving bias. Early on, a review of research on attributions for success and failure reported an association between two personality traits, high self-esteem and external locus of control, and more protective attribution after failure (Zuckerman, 1979). More recently, Norem and Cantor (1986) demonstrated that the self-serving bias, measured as the denial of control over a failed performance relative to a successful performance, was more likely for participants who had an optimistic, as opposed to a defensively pessimistic, strategy. Evidently, the initially higher expectations of optimists strengthened the impact of subsequent failure feedback. Defensive pessimists, in contrast, had initially low expectations which served to cushion the impact of subsequent failure feedback, making defensive attribution less likely. Finally, John and Robins (1994) found an association between narcissism and a tendency to provide more positive evaluations of one’s performance compared to those provided by others. Humanistic psychologists have long argued that those who exhibit optimal psychological development would be less defensive (Maslow, 1954; Deci, 1980). On the basis of self-determination theory, two different predictions could be made with regard to causality orientations and self-serving attribution. First, the effects of autonomy and control orientations on self-serving attribution may be additive such that low autonomy (irrespective of level of control) and high control (irrespective of level of autonomy) would each be associated with more defensive attribution. Stated differently, autonomy and control orientation would each be sufficient to reduce self-serving attribution. In contrast to an additive model, a potentially more interesting possibility is that there is something unique about individuals who are low in control and also high in autonomy orientation. Perhaps these individuals are unique in that not only do they become less ego-involved, but they are also more oriented toward learning and growth. This unique approach to performance situations may buffer them from the tendency to attribute performance defensively. According to this model, referred to as a synergistic effect (Rosenthal & Rosnow, 1991), effects of CAUSALITY ORIENTATIONS 79 a low control orientation or a high autonomy orientation alone tell only half the story; both are necessary to eliminate defensive attribution. Thus, a test of the synergistic model is conducted by examining those who are both high in autonomy and low in control compared to all other participants (see Rosenthal & Rosnow, 1991, for a complete discussion of this issue). On the basis of theoretical and empirical work on self-determination theory, and the assumption asserted by humanistic psychologists that a certain class of individuals do not display defensive behavior, we examined both the additive and synergistic models. Consequently, we investigated the extent to which possessing either a high autonomy or a low control orientation would be sufficient; or whether there is something unique about individuals who are both high in autonomy and low in control that reduces the tendency to attribute performance defensively. An additional factor that might moderate the self-serving bias is the type of task (skill or chance) on which individuals perform. Feedback about performance on a skill task is diagnostic of the person’s ability and, therefore, might trigger attempts to protect and enhance self-esteem. On a chance task, success does not reflect skill and failure does not reflect inability. Therefore, there is less need for a self-serving bias. An exploratory issue for the present study was whether effects of causality orientations on the self-serving bias depend on the type of task (skill vs chance) that was performed. In sum, we measured causality orientations, manipulated the type of feedback (success or failure) and the type of task (skill or chance), and then measured self-serving attribution. We examined both additive and synergistic models of the effect of causality orientations on defensive attribution. We also predicted a weaker self-serving bias for performance on chance tasks and intended to examine whether the type of task would moderate the effect of causality orientations on the self-serving bias. METHOD Participants Participants were 29 male and 49 female undergraduates enrolled in introductory psychology at the University of Rochester. Their participation partially fulfilled a course requirement. Procedure Measuring causality orientations. Participants were run individually. Upon arrival, they were greeted by the experimenter and were told that the study investigated the relation between personality and behavioral style while working on cognitive tasks. They then completed a brief packet of personality questionnaires that contained the General Causality Orientations Scale (GCOS; Deci & Ryan, 1985a).3 The GCOS consists of 12 vignettes, each followed by an autonomous response and a controlled response. Each response, in turn, is followed by a 7-point scale on which the respondent 3 The other personality questionnaires included the realistic and unrealistic control scales (Zuck- 80 KNEE AND ZUCKERMAN rates the extent to which the response would be characteristic of him or her. For example, one of the vignettes is as follows: You are embarking on a new career. The most important consideration is likely to be: The autonomy orientation is measured by the response, ‘‘How interested you are in that kind of work.’’ The control orientation is measured by the response, ‘‘Whether there are good possibilities for advancement.’’ Participants rate each response on a 1 (very unlikely) to 7 (very likely) scale. For each orientation, scores are computed by averaging respondents’ ratings for that orientation across all 12 vignettes. A higher score indicates that the person has more of that particular orientation. The correlation between autonomy and control orientations in the present study was −.10. Manipulating success and failure. After the packet of questionnaires was completed, the experimenter administered a series of three mazes that resulted in either success or failure. Mazes for the failure condition were made impossible to solve by carefully sketching in blockades for every route so that no solution was possible. Similarly, mazes for the success condition were made impossible to not solve by carefully ‘‘whiting out’’ a large portion of blockades so that nearly any path would lead to the goal. A 45-s time limit was set for all mazes. The time limit was derived from pilot testing, according to two criteria: (a) the limit must be long enough to allow everyone in the success condition to solve the mazes, and (b) the limit must be short enough to prevent participants in the failure condition from reaching the end of the maze, and thereby realizing that there is no solution. Every subject in the success condition solved the mazes in less than 45 s. In addition to actually solving (or failing to solve) each maze, participants received false feedback in the form of a percentile score. When the maze was solved within the time limit (success condition), the percentile was presented as the percentage of others who had solved the maze more slowly. When the maze was not solved within the time limit (failure condition), the percentile was presented as the percentage of others who had completed a smaller portion of the correct route than did the participant. Participants in the success condition were told that their percentile rank for each maze was 85, 91, and 89%, respectively; whereas those in the failure condition were told that their percentile rank for each maze was 45, 39, and 43%, respectively. Manipulating skill and chance. Participants were randomly assigned to either a skill or a chance condition. Those in the skill condition were told: We have found that how quickly a maze is solved is based on looking ahead to foresee whether a particular path will lead to success. So, to solve a maze quickly you must have the ability to foresee the outcome of potential paths and you must put this ability to work. If you have the skill, and you apply it, you will perform well. If you don’t have the skill or you fail to apply it, you will perform poorly. Of course, as with all skill tasks, you may do better or worse compared to other people. Participants in the chance condition were told: We have found that how quickly a maze is solved is based solely on chance. This is because, at any specific turn in the maze, it is impossible to foresee which path is the correct one. So you have to choose a path but you cannot know whether the path will solve the maze. Mazes contain many possible paths. Some lead to success and some do not, and it is impossible to foresee which path will be successful. In this way, there may be very little that you can do to significantly improve your performance. Of course, as with all chance tasks, like participating in a lottery for example, you may do better or worse than other people. Following the maze task, participants were administered a follow-up packet of questionnaires that contained all dependent measures. erman, Knee, Kieffer, Rawsthorne, & Bruce (in press). They do not directly concern the present study and will not be discussed further. 81 CAUSALITY ORIENTATIONS SELF-REPORT OF TABLE 1 PERFORMANCE AS A FUNCTION OF FEEDBACK AND TASK Feedback Task Failure Success Skill Chance 2.31 1.43 6.13 5.67 Note. Higher scores indicate better self-reported performance on the mazes. Responsibility attributions. The self-serving bias was operationalized as the extent to which participants who experience success take more responsibility for their performance than participants who experience failure. Four items administered on 7-point likert-type scales assessed (a) the degree to which participants felt responsible for their performance on the mazes; (b) how much credit or blame they take for their performance; (c) the extent to which their performance shows how successful they are in general; and (d) the degree to which their performance was due to their doing as opposed to factors unrelated to them. Affect. Postperformance emotion was measured after responsibility attributions using a brief version of the MAACL (Zuckerman & Lubin, 1965). The shortened MAACL consisted of 32 adjectives with 8 adjectives tapping each of four emotions: anxiety (e.g., fearful), depression (e.g., lost), hostility (e.g., angry), and positivity (e.g., happy). Reliabilities (Cronbach as) were .87, .86, .94, and .91 for anxiety, depression, hostility, and positivity, respectively. It was expected that subjects would experience a more positive mood under success than under failure. Importantly, it was also possible to verify that the difference in self-serving bias due to causality orientations was not simply a function of differences in mood following success and failure. Manipulation checks. To measure the effectiveness of the manipulation of success and failure, participants were asked how well they solved the mazes, on a 7-point scale from 1 (not at all well) to 7 (very well). Our manipulation of skill and chance was measured by four items that assessed the extent to which ability, luck, task difficulty, and effort were reasons for their performance, on 7-point likert-type scales from 1 (was not a reason) to 7 (was a reason).4 Upon completion of the follow-up packet, participants were gently probed for suspicion and debriefed. RESULTS Manipulation Check for Feedback To verify that the manipulation of success and failure was successful, we examined how well participants felt they solved the mazes. This index was submitted to a 2 (task: skill or chance) × 2 (feedback: success or failure) analysis of variance (ANOVA). As shown in Table 1, the expected main effect of feed4 Due to an oversight, the items regarding attribution to luck, ability, task difficulty, and effort, along with the item about how well participants felt they had performed on the maze task, were not administered to the first 24 participants. Also, these items were used as the manipulation check of skill and chance rather than as the measure of self-serving bias precisely because the nature of the task was manipulated. It would be inappropriate to convince participants that a task was based on skill or chance, and then assess self-serving bias via attributions to ability, effort, luck, and task difficulty. 82 KNEE AND ZUCKERMAN back was observed such that those in the success condition felt they had performed better than those in the failure condition, F(1,50) 4 255.19, p < .001, r 4 .91.5 A main effect of task was also observed such that the skill condition elicited feelings of better performance than did the chance condition, F(1,50) 4 7.13, p < .05, r 4 .35. No other effects approached significance (p’s > .10). Given these results for self-reported level of performance, we can be reasonably sure that the feedback manipulation was successful. Manipulation Check for Type of Task The reliability of the four items that measured attribution to luck, effort, ability, and task difficulty, after reversing scores on luck and task difficulty, was low (Cronbach a 4 .07). For this reason, each item was analyzed separately in a 2 (task: skill or chance) × 2 (feedback: success or failure) ANOVA. Attributions to luck were lower in the skill condition than in the chance condition, M’s 4 3.28 and 4.27, respectively, F(1,50) 4 4.16, p < .05, r 4 .28. Attributions to effort showed the opposite pattern, M’s 4 6.86 and 6.41, respectively, F(1,50) 4 5.05, p < .05, r 4 .30. Attributions to ability were similar to those of effort although the difference was not significant, M’s 4 4.54 and 3.99, respectively, F(1,50) 4 1.44, p 4 .24, r 4 .17. A Task × Feedback interaction revealed that the greater attribution to ability in the skill condition was more pronounced under success, F(1,50) 4 5.93, p < .05, r 4 .33. As the chance–skill distinction does not have direct implications for task difficulty, it was not surprising that the latter variable did not repeat the pattern of the three previous attribution measures. A difficult to interpret interaction did emerge, such that attributions to task difficulty under success were relatively high in the skill condition; under failure, they were relatively high in the chance condition, F(1,50) 4 7.52, p < .01, r 4 .36. Effects other than those specified above were not significant. Given that two of the four attribution items yielded the expected effect of task, and a third was in the appropriate direction, we can be reasonably confident that the manipulation of skill and chance was successful. Responsibility Attributions The four responsibility items yielded an a of .81. Accordingly, they were combined to represent a single external–internal index of responsibility attribution. It was predicted that the tendency to take more responsibility for success than failure would be weaker for those with a low control orientation as well as for those with a high autonomy orientation. Consequently, participants were 5 Pearson r, a measure of effect size, was computed as r5 (Rosenthal & Rosnow, 1991). Î F1, F1, + dferror 83 CAUSALITY ORIENTATIONS divided into high and low autonomy and high and low control orientations at the median, and these factors were included in a 2 (task) × 2 (feedback) × 2 (autonomy: high or low) × 2 (control: high or low) ANOVA on the responsibility index. As shown in Table 2, self-serving attribution was confirmed by a main effect of feedback such that those in the success condition took more responsibility for their performance than those in the failure condition, F(1,62) 4 22.00, p < .001, r 4 .51. A main effect of task was obtained such that those in the skill condition took more responsibility for their performance than did those in the chance condition: F(1,62) 4 18.60, p < .001, r 4 .48. In addition, the interaction between feedback and task indicated that self-serving attribution was stronger in the skill condition than the chance condition, F(1,62) 4 3.89, p 4 .05, r 4 .24. Next, we examined both additive and synergistic models of the effect of causality orientations on defensive attributions. An additive model would be supported by two interactions: feedback × control and feedback × autonomy. These interactions would show that control and autonomy each influence defensive attributions. A synergistic model would require a feedback × control × autonomy interaction indicating something unique about those high in autonomy and low in control orientation. Further tests of the synergistic model can then be conducted by comparing those with high autonomy and low control to all other combinations of autonomy and control orientations. Table 3 presents mean attribution to personal responsibility as a function of feedback, control orientation, and autonomy orientation. As can be seen, the self-serving bias (the difference in responsibility attributions between success and failure), was weaker for low control orientation, particularly when autonomy was high. The results of the ANOVA showed a close to significant Feedback × Control interaction, F(1,62) 4 3.74, p < .06, r 4 .24, and, more importantly, a significant Feedback × Control × Autonomy interaction, F(1,62) 4 4.75, p < .05, r 4 .27. Tests of simple effects showed that a self-serving bias (the difference in responsibility attributions between success and failure) was obtained for low control and low autonomy, F(1,62) 4 8.13, p < .01, r 4 .34; for high control and low autonomy, F(1,62) 4 9.84, p < .01, r 4 .37; and for high control and high autonomy, F(1,62) 4 12.52, p < .001, r 4 .41. No self-serving bias was evident RESPONSIBILITY ATTRIBUTIONS TABLE 2 AS A FUNCTION OF FEEDBACK AND TASK Feedback Task Failure Success Skill Chance 3.79 3.17 5.56 3.89 Note. Higher scores indicate greater attribution to personal responsibility. 84 KNEE AND ZUCKERMAN RESPONSIBILITY ATTRIBUTIONS Success n Failure n Difference TABLE 3 FUNCTION OF FEEDBACK, CONTROL ORIENTATION, AUTONOMY ORIENTATION AS A AND High Control orientation High Low Low Low Autonomy orientation High Low High 4.86 13 3.44 12 1.42** 5.14 9 3.04 6 2.10** 4.93 8 3.38 10 1.55** 3.98 8 4.07 12 −.09 ** p < .01. for individuals with a low control orientation and a high autonomy orientation, F(1,62) 4 .03, ns, r 4 .02. We also conducted two synergistic contrasts, one for the success condition and one for the failure condition; each contrast compared the low control and high autonomy cell to all other cells (Rosenthal & Rosnow, 1985, 1991). The contrast under success was significant, indicating that people low in control and high in autonomy were less likely to engage in self-enhancing attributions, F(1,62) 4 7.80, p < .01, r 4 .33. The contrast under failure was also significant, indicating that people low in control and high in autonomy were less likely to engage in defensive attributions, F(1,62) 4 4.90, p < .05, r 4 .27. The effects above were not moderated by the type of task, F 4 .04. However, the type of task did produce two unexpected effects such that the higher responsibility attributions under skill were more pronounced for high (vs low) autonomy orientation, and for high (vs low) control orientation, F(1,62) 4 7.65, p < .01, r 4 .33; F(1,62) 4 5.48, p < .05, r 4 .28, respectively. We can only speculate that those high on autonomy perceive skill tasks as providing more opportunity for challenge and learning and therefore take more responsibility for them. In a complimentary fashion, those high on control are more ego-involved on skill tasks and therefore take more responsibility for them. Affect The affect scores were examined in four separate 2 (task) × 2 (feedback) × 2 (autonomy) × 2 (control) ANOVAs on hostility, depression, anxiety, and positivity, respectively. As expected, participants in the failure condition, relative to those in the success condition, reported less positivity F(1,62) 4 8.89, p < .01, r 4 .35; more depression, F(1,62) 4 11.43, p < .01, r 4 .39; more hostility, F(1,62) 4 24.21, p < .001, r 4 .53; and somewhat more anxiety F(1,62) 4 2.28, CAUSALITY ORIENTATIONS 85 p 4 .14, r 4 .19. No interaction among feedback, autonomy, and control was significant for any of the four dimensions of affect (for hostility, p > .12; for the other three dimensions, p’s > .36). Therefore, it was clear that the effect of causality orientations on self-serving attribution was not due to differences in affect. DISCUSSION The present study demonstrated that causality orientations moderate the selfserving bias. The self-serving bias was evident from a main effect of feedback indicating greater attribution to personal responsibility for success than failure. However, participants low on control and high on autonomy did not display the self-serving bias, whereas all other participants did. Importantly, participants low in control and high in autonomy were less likely to make both self-enhancing attributions under success and defensive attributions under failure. These results support a synergistic model of the effect of causality orientations on self-serving attribution. Our explanation for these results is that a low control orientation reflects an absence of ego-involvement relative to high control orientation (Koestner & Zuckerman, 1994). In addition, a high autonomy orientation, relative to a low autonomy orientation, reflects interest in learning and growth (Deci & Ryan, 1985b). However, neither of these orientations alone is sufficient to prevent a defensive motivational stance and, therefore, does not reduce defensive attribution. Instead, individuals who are both low on control and high on autonomy are unique in that they possess a combination of qualities thought to reflect more genuine and less defensive perception, motivation, and functioning. These individuals perceive less of a threat to self-esteem and invite opportunities for growth and challenge and, therefore, were not motivated to exhibit a self-serving bias. An alternative explanation for these results, however, is that the manipulation of feedback was less effective for those with low control and high autonomy. That is, these participants could have considered their performance less successful in the success condition and less poor in the failure condition. Evidence against this alternative explanation was provided from a 2 (task) × 2 (feedback) × 2 (autonomy) × 2 (control) ANOVA with participants’ self-report of their performance on the mazes as the dependent variable. Only the expected feedback effect and a task effect were obtained; no interactions between feedback and control nor among feedback, control, and autonomy were observed (p’s > .76 and .20, respectively), indicating that the effectiveness of the feedback manipulation did not depend on participants’ causality orientations. In addition, it was previously shown that individuals low in control and high in autonomy did not manifest less positive affect (and more negative affect) following success than following failure. A secondary finding was that self-serving attribution was stronger for a skill- 86 KNEE AND ZUCKERMAN based task than for a chance-based task. Because performance on a skill task is diagnostic of ability, attributional defenses come in very handy. The threat to self-esteem, however, is much weaker when performance is thought to be based on chance. The lower motivation to defend self-esteem on a chance-determined task may eventuate in weaker self-serving attribution. One fruitful avenue for future research might be the further exploration of whether causality orientations moderate other defensive strategies like selfhandicapping (Berglas & Jones, 1978; Snyder, 1990; Tice, 1991) or downward comparison (Wills, 1981). Based on the results of the present study, one might expect to observe less self-handicapping and less downward comparison for those who are low on control and high on autonomy than for other combinations of control and autonomy orientations. In summary, the present study provides support for the theoretical work that links a pressured, ego-involved, threat-salient mode of functioning to defensive attributional tendencies (Deci & Ryan, 1987; Nicholls, 1984). Second, it points to the utility of considering participants’ autonomy and control orientations in a synergistic conceptual framework. Having either a high autonomy or low control orientation by itself will not guarantee freedom from defensive strategies. Only the unique combination of both orientations can eliminate the need to defend the self. Further research may identify relations between causality orientations and other defensive tendencies. REFERENCES Berglas, S., & Jones, E. E. (1978). Drug choice as a self-handicapping strategy in response to noncontingent success. Journal of Personality and Social Psychology, 36, 405–417. Bradley, G. W. (1978). Self-serving biases in the attribution process: A reexamination of the fact or fiction question. Journal of Personality and Social Psychology, 36, 56–71. Deci, E. L. (1980). The psychology of self-determination. Lexington, MA: D. C. Heath (Lexington Books). Deci, E. L., & Ryan, R. M. (1985a). The general causality orientations scale: Self-determination in personality. Journal of Research in Personality, 19, 109–134. Deci, E. L., & Ryan, R. M. (1985b). Intrinsic motivation and self-determination in human behavior. New York: Plenum. Deci, E. L., & Ryan, R. M. (1987). The support of autonomy and the control of behavior. Journal of Personality and Social Psychology, 53, 1024–1037. Deci, E. L., & Ryan, R. M. (1991). A motivational approach to self: Integration in personality. In R. Dienstbier (Ed.), Nebraska Symposium on Motivation (Vol. 38, pp. 237–288). Lincoln: University of Nebraska Press. Ditto, P. H., & Lopez, D. F. (1992). Motivated skepticism: Use of decision criteria for preferred and nonpreferred conclusions. Journal of Personality and Social Psychology, 63, 568–584. Dweck, C. S., & Leggett, L. (1988). A social–cognitive approach to motivation and personality. Psychological Review, 95, 256–273. Greenberg, J. (1991). Motivation to inflate performance ratings: Perceptual bias or response bias? Motivation and Emotion, 15, 81–97. Greenberg, J., Pyszczynski, T., & Solomon, S. (1982). The self-serving attributional basis: Beyond self-presentation. Journal of Experimental Social Psychology, 18, 56–67. CAUSALITY ORIENTATIONS 87 John, O. P., & Robins, R. W. (1994). Accuracy and bias in self-perception: Individual differences in self-enhancement and the role of narcissism. Journal of Personality and Social Psychology, 66, 206–219. Koestner, R., & Zuckerman, M. (1994). Causality orientations, failure, and achievement. Journal of Personality, 62, 321–346. Maslow, A. H. (1954). Motivation and personality. New York: Harper. Miller, D. T. (1978). What constitutes a self-serving attributional bias? A reply to Bradley. Journal of Personality and Social Psychology, 36, 1221–1223. Miller, D. T., & Ross, M. (1975). Self-serving biases in attribution of causality: Fact or fiction? Psychological Bulletin, 82, 213–225. Nicholls, J. G. (1984). Achievement motivation: Conceptions of ability, subjective experience, task choice, and performance. Psychological Review, 91, 328–346. Norem, J. K., & Cantor, N. (1986). Anticipatory and post-hoc cushioning strategies: Optimism and defensive pessimism in ‘‘risky’’ situations. Cognitive Therapy and Research, 10, 347–362. Pyszczynski, T., & Greenberg, J. (1987). Toward an integration of cognitive and motivational perspectives on social inference: A biased hypothesis-testing model. In L. Berkowitz (Ed.), Advances in experimental social psychology (Vol. 20, pp. 297–340). Orlando, FL: Academic Press. Rosenthal, R., & Rosnow, R. L. (1985). Contrast analysis: Focused comparisons in the analysis of variance. Cambridge, UK: Cambridge Univ. Press. Rosenthal, R., & Rosnow, R. L. (1991). Essentials of behavioral research: Methods and data analysis. New York: McGraw–Hill. Ross, M., & Fletcher, G. J. O. (1985). Attribution and social perception. In G. Lindzey & E. Aronson (Eds.), The handbook of social psychology (3rd ed., pp. 73–122). Reading, MA: AddisonWesley. Ryan, R M. (1982). Control and information in the intrapersonal sphere: An extension of cognitive evaluation theory. Journal of Personality and Social Psychology, 43, 450–461. Ryan, R. M., Koestner, R., & Deci, E. L. (1991). Varied forms of persistence: When free-choice behavior is not intrinsically motivated. Motivation and Emotion, 15, 185–205. Snyder, C. R. (1990). Self-handicapping processes and sequelae: On the taking of a psychological dive. In R. L. Higgins, C. R. Snyder, & S. C. Berglas (Eds.), Self-handicapping: The paradox that isn’t (pp. 107–145). New York: Plenum Press. Tice, D. M. (1991). Esteem protection or enhancement? Self-handicapping motives and attributions differ by trait self-esteem. Journal of Personality and Social Psychology, 60, 711–725. Weary, G. (1979). Self-serving attributional biases: Perceptual or response distortions? Journal of Personality and Social Psychology, 37, 1418–1420. Wills, T. A. (1981). Downward comparison principles in social psychology. Psychological Bulletin, 90, 245–271. Zuckerman, M. (1979). Attribution of success and failure revisited, or: The motivational bias is alive and well in attribution theory. Journal of Personality, 47, 245–287. Zuckerman, M., Knee, C. R., Kieffer, S. C., Rawsthorne, L., & Bruce, L. M. (in press). Beliefs in realistic and unrealistic control: Assessment and implications. Journal of Personality. Zuckerman, M., & Lubin, B. (1965). Manual for the multiple affect adjective check list. San Diego, CA: Educational and Industrial Testing Service.
