28-Aug-12
HAWKES LEARNING SYSTEMS
math courseware specialists
Copyright © 2010 by Hawkes Learning
Systems/Quant Systems, Inc.
All rights reserved.
Discovering Statistics
Table of Contents
HAWKES LEARNING SYSTEMS
math courseware specialists
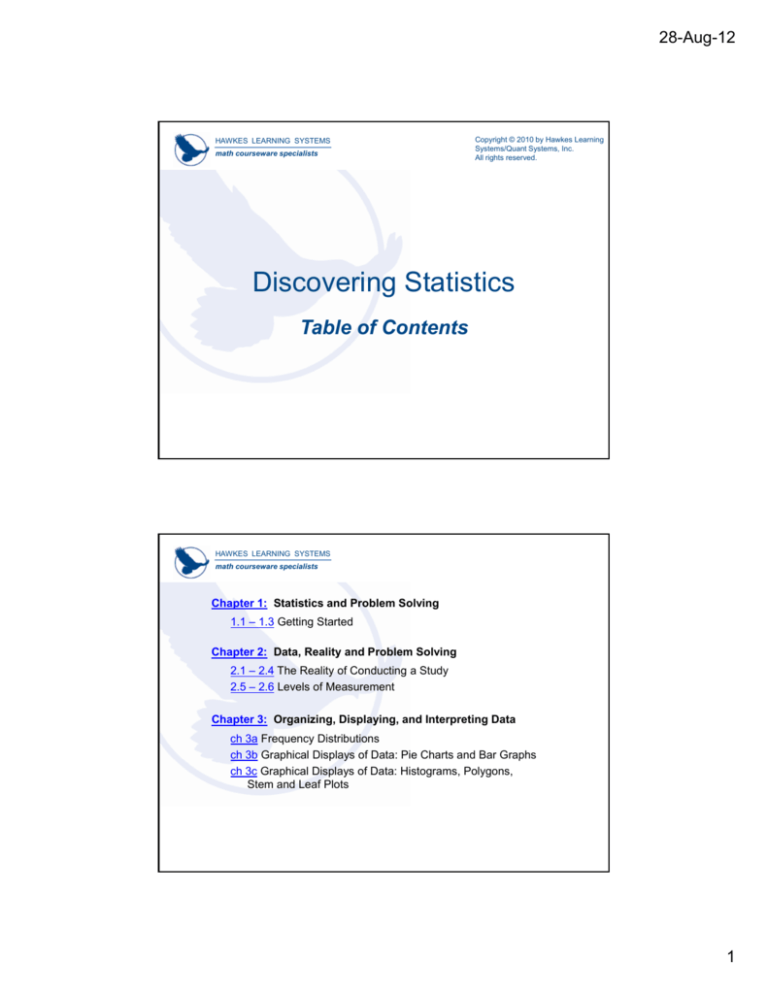
Chapter 1: Statistics and Problem Solving
1.1 – 1.3 Getting Started
Chapter 2: Data, Reality and Problem Solving
2.1 – 2.4 The Reality of Conducting a Study
2.5 – 2.6 Levels of Measurement
Chapter 3: Organizing, Displaying, and Interpreting Data
ch 3a Frequency Distributions
ch 3b Graphical
p
Displays
p y of Data: Pie Charts and Bar Graphs
p
ch 3c Graphical Displays of Data: Histograms, Polygons,
Stem and Leaf Plots
1
28-Aug-12
HAWKES LEARNING SYSTEMS
math courseware specialists
Chapter 4: Describing Data from One Variable
4.1 – 4.3a Measures of Location
4.1 – 4.3b Measures of Dispersion
4.4 Measures of Relative Position
4.5 – 4.10 Applying the Standard Deviation
Chapter 5: Discovering Relationships
5.2 – 5.5 Scatter Plots and Correlation
5.6 – 5.9 Fitting a Linear Model
Chapter 6: Probability,
Probability Randomness,
Randomness and Uncertainty
6.1 – 6.4 Classical Probability
6.5 – 6.11 Basic Probability Rules
6.12a Basic Counting Rules
HAWKES LEARNING SYSTEMS
math courseware specialists
Chapter 7: Probability Distributions, Information about the Future
7.1 Types of Random Variables
7.2 Discrete Probability Distributions
7.3 Expected Value
7.4 Variance of a Discrete Random Variable
7.7 The Binomial Distribution
7.8 The Poisson Distribution
7.9 The Hypergeometric Distribution
Chapter 8: Continuous Random Variables
8.2 The Normal Distribution
8.3 Standard Normal
8.4 z–Transformations
8.5 Approximations to Other Distributions
2
28-Aug-12
HAWKES LEARNING SYSTEMS
math courseware specialists
Chapter 9: Samples and Sampling Distributions
9.6 Sampling Distributions (Means)
9.7 Central Limit Theorem
9.8 Sampling Distributions (Proportions)
Chapter 10: Estimating Means and Proportions
10.1 − 10.3 Introduction to Estimating Means
10.4, 10.6 Interval Estimation of the Population Mean
10.5a-b Interval Estimation of the Population Mean for a
p
with Sigma
g
Unknown
Normal Population
10.7 – 10.9 Estimation (Proportions)
HAWKES LEARNING SYSTEMS
math courseware specialists
Chapter 11: Introduction to Hypothesis Testing
11.1 Developing a Hypothesis
11.2 Reaching a Conclusion
11.4 Hypothesis Testing About a Population Mean
Chapter 12: Additional Topics with Hypothesis Testing
12.1 Hypothesis Testing Proportions
12.2 Testing Hypothesis about a Population Variance
12.3 Comparing Two Means
12 4 Paired Difference
12.4
12.5 Comparing Two Population Proportions
3
28-Aug-12
HAWKES LEARNING SYSTEMS
math courseware specialists
Chapter 13: Regression, Inference, and Model Building
13.1 Assumptions of the Simple Linear Model
13.2 How Good is the Estimate of β1?
13.4 Inference Concerning Model’s Prediction
13.8 Inference Concerning the Coefficients of the Multiple
Regression Model
Chapter 14: The Analysis of Variance (ANOVA)
14.2 ANOVA
p
of the Test
14.3 Assumptions
14.4 The F-Test
HAWKES LEARNING SYSTEMS
math courseware specialists
Chapter 15: Looking for Relationships in Qualitative Data
15.2 Chi-Square Test for Goodness of Fit
15.3 Chi-Square Test for Association Between Two
Qualitative Variables
Chapter 17: Statistical Process Control
17.3 Monitoring with an x-bar Chart
17.4 Monitoring with an R Chart
17.5 Monitoring with a p Chart
4

