Nicollet County Profile - Region Nine Development Commission
advertisement
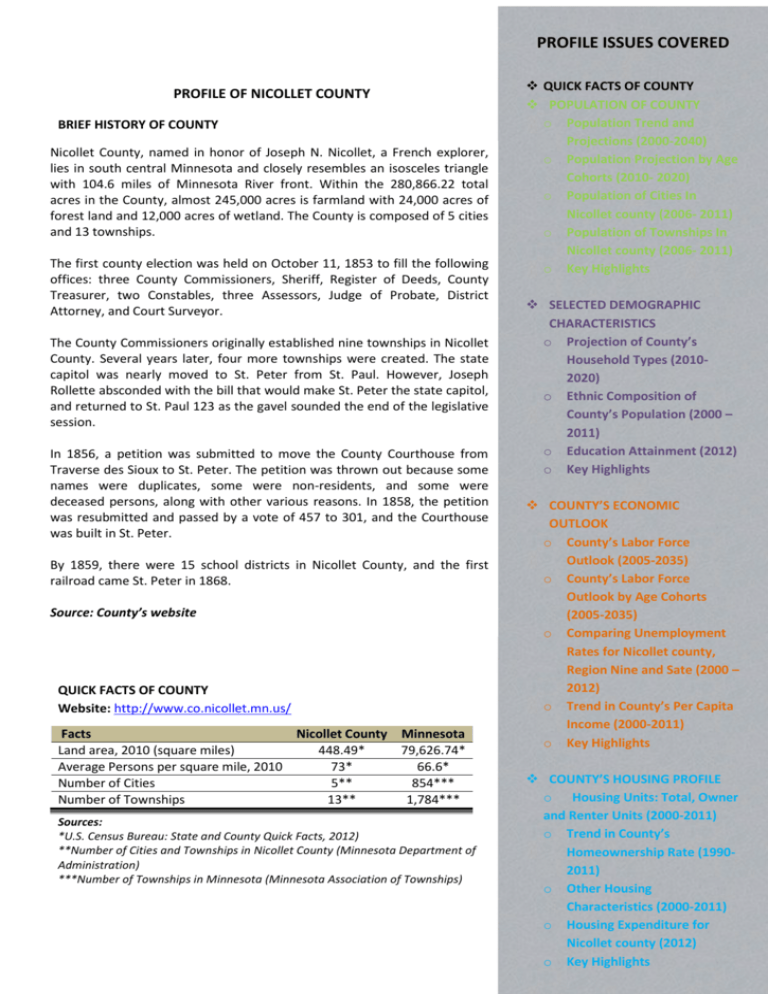
PROFILE ISSUES COVERED PROFILE OF NICOLLET COUNTY BRIEF HISTORY OF COUNTY Nicollet County, named in honor of Joseph N. Nicollet, a French explorer, lies in south central Minnesota and closely resembles an isosceles triangle with 104.6 miles of Minnesota River front. Within the 280,866.22 total acres in the County, almost 245,000 acres is farmland with 24,000 acres of forest land and 12,000 acres of wetland. The County is composed of 5 cities and 13 townships. The first county election was held on October 11, 1853 to fill the following offices: three County Commissioners, Sheriff, Register of Deeds, County Treasurer, two Constables, three Assessors, Judge of Probate, District Attorney, and Court Surveyor. The County Commissioners originally established nine townships in Nicollet County. Several years later, four more townships were created. The state capitol was nearly moved to St. Peter from St. Paul. However, Joseph Rollette absconded with the bill that would make St. Peter the state capitol, and returned to St. Paul 123 as the gavel sounded the end of the legislative session. In 1856, a petition was submitted to move the County Courthouse from Traverse des Sioux to St. Peter. The petition was thrown out because some names were duplicates, some were non-residents, and some were deceased persons, along with other various reasons. In 1858, the petition was resubmitted and passed by a vote of 457 to 301, and the Courthouse was built in St. Peter. By 1859, there were 15 school districts in Nicollet County, and the first railroad came St. Peter in 1868. Source: County’s website QUICK FACTS OF COUNTY Website: http://www.co.nicollet.mn.us/ Facts Nicollet County Minnesota Land area, 2010 (square miles) 448.49* 79,626.74* Average Persons per square mile, 2010 73* 66.6* Number of Cities 5** 854*** Number of Townships 13** 1,784*** Sources: *U.S. Census Bureau: State and County Quick Facts, 2012) **Number of Cities and Townships in Nicollet County (Minnesota Department of Administration) ***Number of Townships in Minnesota (Minnesota Association of Townships) QUICK FACTS OF COUNTY POPULATION OF COUNTY o Population Trend and Projections (2000-2040) o Population Projection by Age Cohorts (2010- 2020) o Population of Cities In Nicollet county (2006- 2011) o Population of Townships In Nicollet county (2006- 2011) o Key Highlights SELECTED DEMOGRAPHIC CHARACTERISTICS o Projection of County’s Household Types (20102020) o Ethnic Composition of County’s Population (2000 – 2011) o Education Attainment (2012) o Key Highlights COUNTY’S ECONOMIC OUTLOOK o County’s Labor Force Outlook (2005-2035) o County’s Labor Force Outlook by Age Cohorts (2005-2035) o Comparing Unemployment Rates for Nicollet county, Region Nine and Sate (2000 – 2012) o Trend in County’s Per Capita Income (2000-2011) o Key Highlights COUNTY’S HOUSING PROFILE o Housing Units: Total, Owner and Renter Units (2000-2011) o Trend in County’s Homeownership Rate (19902011) o Other Housing Characteristics (2000-2011) o Housing Expenditure for Nicollet county (2012) o Key Highlights POPULATION OF COUNTY POPULATION OF CITIES IN NICOLLET COUNTY (2006- 2011) KEY HIGHLIGHTS POPULATION TREND AND PROJECTIONS (2000-2040) The county’s population is projected to increase by a rate of between 3.1 – 4.1 per cent every five years from 2010 to 2040. 43,000 41,000 39,000 Population less than 19years are expected to account for 28 per cent of the County’s projected population increase in 2020. This represents 24 per cent increase in the less than 19 years population group (comparing the 2010 and 2020 populations). 37,000 35,000 33,000 31,000 City Courtland Lafayette Nicollet North Mankato St. Peter 2006 2007 2008 2009 2010 2011 589 521 991 12,817 10,887 591 479 1,000 12,935 10,966 598 479 1,008 13,003 10,884 609 485 1,012 13,045 10,917 611 504 1,093 0 11,196 606 500 1,091 0 11,459 Data Source: MN State Demographic Center, 2012 29,000 All cohort groups above 65+ cohort are expected to increase, meaning around 17 per cent of the County’s population in 2020 will be 65+ years old. This number is 64 per cent more of what was recorded in 2010 implying possible increase in demand for Senior Housing and health care needs in the County. 27,000 25,000 2000 2010 Total Population 29,771 32,727 2015 2020 2025 2030 2035 2040 33937 35340 36662 37897 39087 40280 Data Source: MN State Demographic Center, 2012 Township 2006 2007 2008 2009 2010 2011 Belgrade 1,038 1,018 1,016 1,020 1,052 1,047 Bernadotte 350 348 343 340 278 272 Brighton 157 156 155 157 149 150 Courtland 705 706 702 704 630 616 3500 Granby 248 251 249 251 246 242 3000 Lafayette 700 697 695 696 694 688 Lake Prairie 614 604 602 599 672 670 New Sweden 323 324 325 331 297 290 Nicollet 503 496 495 497 527 521 1500 Oshawa 530 527 526 531 502 502 1000 Ridgely 103 98 100 105 115 113 Traverse 359 351 352 352 334 331 West Newton 499 493 490 498 423 415 POPULATION PROJECTION BY AGE COHORTS (2010- 2020) 4000 Cohort Population POPULATION OF TOWNSHIPS IN NICOLLET COUNTY (2006- 2011) 2500 2000 500 0 AGE COHORTS 0 - 4 10-14 15-19 20-24 25-29 30-34 35-39 40-44 45-49 50-55 56-59 60-64 65-69 70-74 75-79 80-84 85+ 2010 2100 1770 5-9 1790 2430 3670 3050 1940 1690 1900 2330 2400 2050 1700 1040 850 640 480 580 2020 2208 2557 2372 2901 2702 1489 2108 2956 2049 1806 1832 2207 2252 1995 1556 934 711 705 Data Source: MN State Demographic Center, 2012 Data Source: MN State Demographic Center, 2012 SELECTED DEMOGRAPHIC CHARACTERISTICS ETHNIC COMPOSITION OF COUNTY’S POPULATION (2000 – 2011) PROJECTION OF COUNTY’S HOUSEHOLD TYPES (2010- 2020) 2010 960, 11% 780, 8% Married Couples with Children 800, 9% Ethnic Group 2020 Other Families with Children 1220, 13% White alone Married Couples with Children 2820, 30% 2890, 33% Hispanic or Latino Asian alone Other Families with Children Black or African American alone Nonfamily Households, Living Alone Nonfamily Households, Living Alone Living Alone, 65+ 3130, 35% 1050, 12% 3570, 37% 1140, 12% Living Alone, 65+ Other Nonfamily Households Native Hawaiian and Other Pacific Islander alone Some Other Race alone Other Nonfamily Households Data Source: MN State Demographic Center, 2012 American Indian and Alaska Native alone Data Source: MN State Demographic Center, 2012 KEY HIGHLIGHTS With projected decline of 2.4 per cent in the number of “Married Couples with Children” and 14 per cent increase in ““Non-family households living alone” in 2020, there might be potential increase in demand for single family housing in Nicollet County. Two or more races More than half (66 per cent) of the county’s 25+ population can be categorized as highly skilled labor force based on their education attainment (i.e. having attained more than high school degree). 2005-2009 2010 2011 28,405 29,489 29,688 29,772 535 835 1,110 1,165 335 438 355 383 232 452 601 668 59 84 108 128 5 10 9 1 8 72 65 51 192 314 335 303 Data Source: US Census Bureau, 2012 EDUCATION ATTAINMENT (2012) TOTAL Population Age 25+ < Grade 9 The population of “Hispanic or Latino”, “Black or African American alone”, and “American Indian and Alaska Native alone” ethnic groups have significantly increased since 2000. In all, the percentage composition of minority ethnic groups (all except “white alone”) in the county’s population has increased from 4.6 per cent (in 2000) to 8.3 per cent (in 2011). 2000 Grade 9-12 High School Some College Assoc Degree Bach Degree Grad Degree % 20,623 619 3 1,007 4.88 5,495 26.65 4,557 22.1 2,031 9.85 4,683 22.71 2,231 10.82 Data Source: MN Department of Employment and Economic Development (MN DEED), 2012 COUNTY’S ECONOMIC OUTLOOK COUNTY’S LABOR FORCE OUTLOOK BY AGE COHORTS (20052035) COUNTY’S LABOR FORCE OUTLOOK (2005-2035) KEY HIGHLIGHTS 16 to 24 21000 Total labor force population is expected to increase till 2025 when it starts decreasing, then begins to increase again in 2035. 20500 20000 19000 3000 2000 1000 0 18000 17500 Total 65+ 4000 An individual earns about 13 per cent less annually of what is averagely earned by a person statewide (using the 2011 per capita income statistics). 18500 45 to 64 5000 Both the unemployment rate and per capita income of the County have been lower than the State’s since 2000. 19500 25 to 44 6000 2005 2010 2015 2020 2025 2030 2035 16 to 24 1780 1410 1230 1140 1160 1170 1160 25 to 44 3990 3840 3820 3770 3710 3480 3380 2005 2010 2015 2020 2025 2030 2035 45 to 64 4920 5030 4760 4340 3750 3600 3620 18830 20010 20670 20830 20750 20640 20780 65+ 650 760 970 1190 1340 1240 1110 Data Source: MN DEED), 2012 Data Source: MN DEED, 2012 COMPARING UNEMPLOYMENT RATES FOR BROWN COUNTY, REGION NINE AND STATE (2000 – 2012) 9 Nicollet County Region Nine TREND IN COUNTY’S PER CAPITA INCOME (2000-2011) Minnesota Nicollet County Minnesota 50000 8 45000 40000 6 Per Capita Income ($) Unmeployment Rate 7 5 4 3 2 1 0 35000 30000 25000 20000 15000 2000 2001 2002 2003 2004 2005 2006 2007 2008 2009 2010 2011 2012 10000 Nicollet County 2.5 3.6 3.2 3.9 3.4 3.2 3.4 4.1 5.1 6.3 5.6 4.5 4.2 Region Nine 3.4 4.3 4 4.8 4.2 4.3 4.4 5 6.4 7.4 6.4 5.4 4.9 Nicollet County 26613 27208 27180 28904 30924 32158 34296 34665 37160 35228 36580 38630 Minnesota 3.1 4.4 4.3 4.8 4.3 4.2 4.4 4.9 6.6 7.7 7 5.8 5.2 Minnesota Data Source: MN DEED, 2012 2000 2001 2002 2003 2004 2005 2006 2007 2008 2009 2010 2011 32599 33348 34071 35252 37017 37892 39867 41642 43466 40950 42528 44560 Data Source: US Bureau of Economic Analysis, 2012 COST OF LIVING COUNTY’S HOUSING PROFILE HOUSING UNITS: TOTAL, OWNER AND RENTER UNITS (2000-2011) Owner-occupied Renter-occupied Total housing units KEY HIGHLIGHTS TREND IN COUNTY’S HOMEOWNERSHIP RATE (1990-2011) Housing units increased by 14.1 per cent in 2011 Nicollet County 14000 (compared with the number of housing units in 2000). 77% 12000 However, although both owner-occupied and renter- 76% 10000 occupied housing units have decreased since 2000, the 8000 75% 74% decrease in renter-occupied housing units is minimal. 73% 6000 72% 4000 71% The vacancy rates for both owner and renter occupied units 2000 0 Minnesota 70% have also decreased in 2011. 2000 2005-2009 2006-2010 2007-2011 Owner-occupied 8,065 8817 8,965 9053 Renter-occupied 2,577 3262 3,236 3194 Total housing units 11,240 12674 12,873 12860 Although higher than the State’s, the gap between the County’s and State’s homeownership rates started closing since 2006. 69% 1990 2000 2006-2010 2007-2011 Nicollet County 72.90% 75.80% 74.30% 73.9% Minnesota 71.8% 74.6% 74.2% 73.6% Data Source: Compiled from Decennial Census and U.S. Census Bureau, American Community Survey Data Source: MN State Demographic Center, 2012 Annually, rent cost per household represents 31% of the total housing cost paid by a homeowner. HOUSING EXPENDITURE FOR BROWN COUNTY (2012) OTHER HOUSING CHARACTERISTICS (2000-2011) 2000 2005-2009 2006-2010 2007-2011 10,642 12079 12,201 12247 598 595 672 613 Population in owner-occupied housing units 21,939 23,288 23,345 23338 Population in renter-occupied housing units 5,280 6,498 6,662 6843 Characteristics Occupied housing units Vacant housing units Homeowner vacancy rate (percent) 1.2 - 1.8 0.6 Rental vacancy rate (percent) 8.7 - 7.3 3.7 Average household size of owner-occupied units 2.72 2.64 2.6 2.58 Average household size of renter-occupied units 2.05 1.99 2.06 2.14 Mortgage Interest Property Taxes Miscellaneous Owned Dwelling Costs Rental Costs Other Lodging Data Source: MN DEED, 2012(mnprospector.com) Data Source: US Census Bureau, 2012 $ PER HOUSEHOLD TOTAL $000'S $4,232 $51,925 $1,820 $22,336 $1,417 $17,389 $2,317 $28,436 $598 $7,340
