Frequency and Transmission Intensity in a Can
advertisement

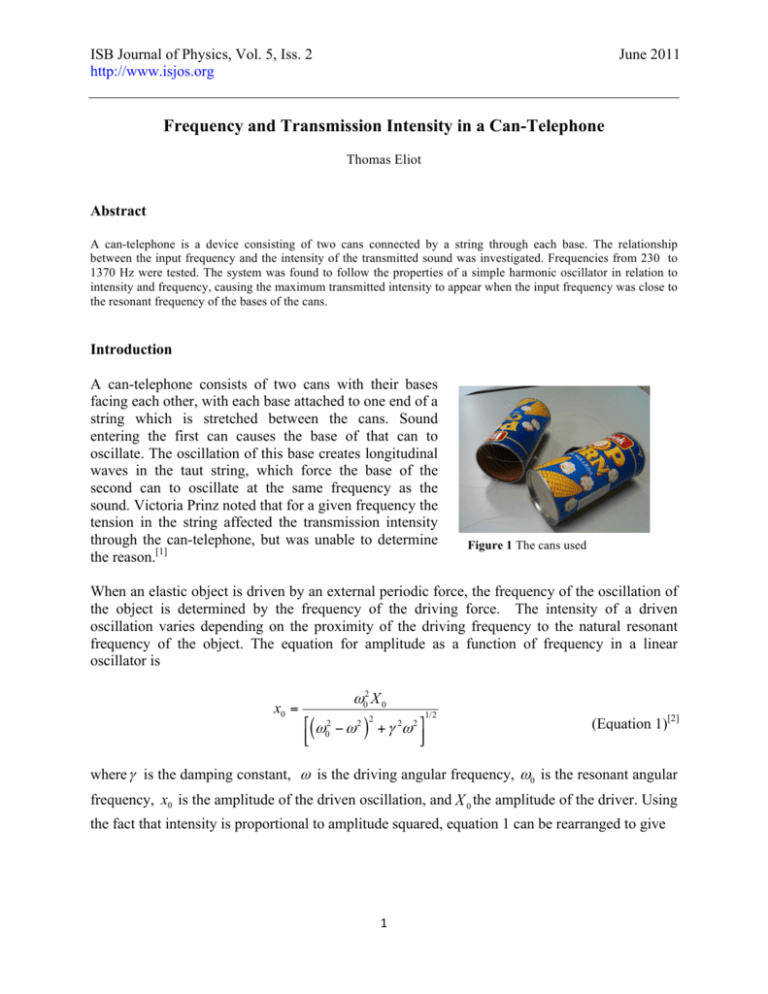
ISB Journal of Physics, Vol. 5, Iss. 2 http://www.isjos.org June 2011 Frequency and Transmission Intensity in a Can-Telephone Thomas Eliot Abstract A can-telephone is a device consisting of two cans connected by a string through each base. The relationship between the input frequency and the intensity of the transmitted sound was investigated. Frequencies from 230 to 1370 Hz were tested. The system was found to follow the properties of a simple harmonic oscillator in relation to intensity and frequency, causing the maximum transmitted intensity to appear when the input frequency was close to the resonant frequency of the bases of the cans. Introduction A can-telephone consists of two cans with their bases facing each other, with each base attached to one end of a string which is stretched between the cans. Sound entering the first can causes the base of that can to oscillate. The oscillation of this base creates longitudinal waves in the taut string, which force the base of the second can to oscillate at the same frequency as the sound. Victoria Prinz noted that for a given frequency the tension in the string affected the transmission intensity through the can-telephone, but was unable to determine the reason.[1] Figure 1 The cans used When an elastic object is driven by an external periodic force, the frequency of the oscillation of the object is determined by the frequency of the driving force. The intensity of a driven oscillation varies depending on the proximity of the driving frequency to the natural resonant frequency of the object. The equation for amplitude as a function of frequency in a linear oscillator is x0 = ω02 X 0 1/2 ⎡(ω 2 − ω 2 )2 + γ 2ω 2 ⎤ ⎢⎣ 0 ⎥⎦ (Equation 1)[2] where γ is the damping constant, ω is the driving angular frequency, ω0 is the resonant angular frequency, x0 is the amplitude of the driven oscillation, and X 0 the amplitude of the driver. Using the fact that intensity is proportional to amplitude squared, equation 1 can be rearranged to give 1 ISB Journal of Physics June 2011 IT = I I f 04 (f 2 0 2 − f 2) +γ 2 f 2 (Equation 2) where f is driving frequency, f0 is resonant frequency, I I2 is input intensity and I T2 is transmitted intensity. In the can-telephone system, the bases of each can are expected to act as linear oscillators, experiencing a restoring force as they are displaced by the input sound and the fishing line. The transmission intensity for the system would then be determined by the natural resonant frequencies of the can bases and the frequency of the input sound, as in equation 2. Method The can-telephone used was constructed by puncturing holes in the center of the base of each can, threading through fishing line, and tying a knot at the end of line.The cans used had cylindrical cardboard walls, with a circular metal base.The length of the fishing line used was 162.0 ± 0.2cm, the diameter of the base of the can was 7.7 ± 0.1cm, Pressure Microphone Decibel Meter Cans Fishing Line Speaker (Inside Can) Pulley Weight Frequency Generator Foam Insulation Figure 2 The experimental apparatus. In reference to figure 2, the weight and pulley on the end of the string attached to the second can was used to put 5.39N±0.01N of tension on the fishing line and the bases of the cans. The tension force on the bases of the cans also affects their natural resonant frequencies, so the mass was used to keep the tension constant and quantifiable. The speaker attached to the freqency generator was suspended inside the first can without contacting it, and used to generate the input sound for the can-telephone at different frequencies. Altering the frequency of the frequency generator also affected the intensity of the sound, so a decibel meter was placed inside the can at a fixed location and the output of the speaker was adjusted to keep the decibel level constant. The pressure microphone in the second can was also suspended without contacting the can, and was used to measure sound pressure received in the second can, which was converted to intensity. 2 ISB Journal of Physics June 2011 Sound with a constant intensity at 9 frequencies ranging from 229.4Hz to 1373.3Hz was played into the first can, and the transmitted sound was recorded using the pressure microphone, with an experimental uncertainty of ±7 µWm-2. Each frequency was tested 3 times. The frequency of the sound was determined by performing an FFT on pressure data from the microphone, and had anuncertainty of ±0.2 Hz. Pressure data from the microphone was converted to intensity through the equation I= P2 2ρv (Equation 3)[3] where I is intensity, ρ is the mass density of air, v is the speed of sound in air and P is the pressure measured by the microphone. To ensure equation 2 was applicable to the bases of the cans, it was determined experimentally that they followed Hooke’s law. One can was suspended vertically, and a force probe and various masses were hung from the fishing line strung through its base. Varying the force across 10 values from 0 to 15N, the displacement at the center of the base was measured using vernier calipers. The natural resonant frequency of the bases was also found by recording the sound produced when the base of the can was struck with no tension on the string. Results and Discussion Figure 3 shows that the cans approximately follow Hooke’s law, in that the displacement of the base is proportional to the force on the base, meaning equation 2 may apply to them. Figure 4 shows the relationship between source frequency and transmitted intensity is IT = 1.01µWm-2 (520Hz ) 2 4 (5202 Hz2 − f 2 Hz 2 ) + 34.42 f 2 Hz 2 The relationship follows equation 2 as predicted. The constant 1.01µWm-2 however, depends on at least two factors, the initial intensity of the sound produced by the speaker in the first can and a constant representing energy loss during transmission through the system. The points in Figure 3 exhibit a peak of intensity as the driving frequency gets closer to the natural resonant frequencies of the bases of the cans. The frequency (Equation 4) Figure 3 Force on the base of the can vs. displacement of the base. 3 ISB Journal of Physics June 2011 which produces the maximum intensity given by the fit is 520 ± 4Hz. For the first can in the system, the natural resonant frequency of the base was 548.9 ± 0.4Hz. For the second can in the system, the receiving can, the resonant frequency was 515 ± 3Hz. While the resonant frequencies of the two cans differed slightly, a possible peak for intensity would likely lie somewhere between the two frequencies, or around 530 ± 10Hz. The resonant frequency of the second can is the same within Figure 4 A relationship between source frequency and received uncertainties as the frequency which intensity is shown, with equation 1 fit to the data, where B is the produces the maximum intensity. frequency of maximum transmission. This suggests that the second can has greater significance in determining the frequency that produces the maximum intensity in the can-telephones. Further research, including switching the transmitting and receiving cans would be needed to further understand this relationship. It must be noted that when measuring the natural resonant frequency of the base of the cans, it was found that the force on the string through the base affected the natural resonant frequency of the base of the cans, with higher forces causing lower resonant frequencies. Also, it was found that even with no force on the base of the can, the orientation of the can affected the resonant frequency. In the case investigated in this lab, the cans were horizontal (the base being vertical), so the natural resonant frequency was measured with the cans horizontal. More research would be required to determine the nature of these phenomena. An issue which affects the certainty and applicability of equation 3 is the number of data points close to the peak of intensity in figure 4. While there are 9 total points of data, there are only two data points close to the natural resonant frequency, and both of these points are at frequencies lower than the natural resonant frequency. It is recommended that this investigation be repeated with many more measurements near the peak frequency. It would also be valuable to investigate how tension on the string affects the intensity of transmission of the sound. Conclusion The relationship between driving frequency and intensity of a sound wave propagated through a can-telephone system follows the model of a driven linear oscillator. Maximum transmitted intensity occurs when the driving frequency is equal to the natural resonant frequency of the bases of the cans. For the specific can-telephone system used in this experiment, a driving frequency of 517±4 Hz causes the maximum intensity of sound received at the second can to be equal, within uncertainties, to the natural resonant frequency of the bases of the cans. 4 ISB Journal of Physics June 2011 References [1] Prinz, Victoria. (2010). Tension and Intensity in a Tin-Can Telephone (Unpublished Experimental Investigation). International School Bangkok, Nonthaburi, Thailand. [2] Fitzpatrick, R. (2010, October 11). Driven damped harmonic oscillation. In Oscillations and Waves. Retrieved from http://farside.ph.utexas.edu/teaching/315/Waves/node12.html [3] Elert, Glenn. Intensity. In The Physics Hypertextbook. Retrieved from http://physics.info/intensity/ 5


