Lecture 5 Planning and Control 10 The nature of
advertisement

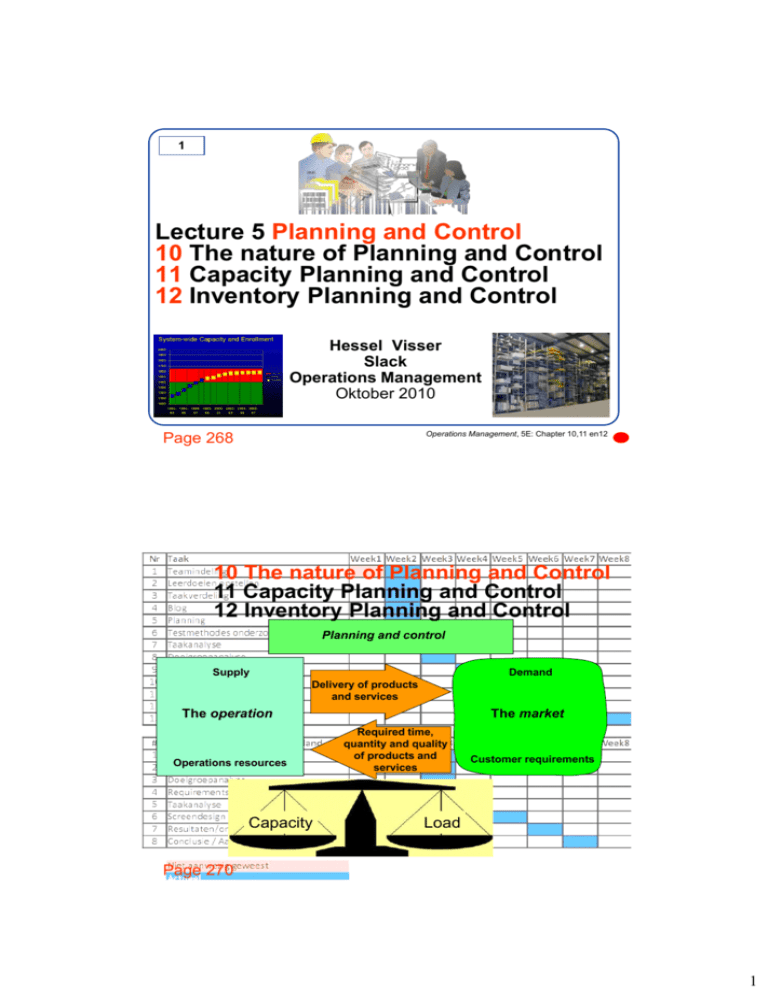
1 Lecture 5 Planning and Control 10 The nature of Planning and Control 11 Capacity Planning and Control 12 Inventory Planning and Control Hessel Visser Slack Operations Management Oktober 2010 Operations Management, 5E: Chapter 10,11 en12 Page 268 2 10 The nature of Planning and Control 11 Capacity Planning and Control 12 Inventory Planning and Control Planning and control Supply Demand Delivery of products and services The operation Operations resources Capacity Page 270 The market Required time, quantity and quality of products and services Customer requirements Load Operations Management, 5E: Chapter 10,11 en12 1 CONTROL Operations Management, 5E: Chapter 10,11 en12 Page 271 4 PLANNING Days/weeks/months Hours/days Time horizon Months/years 3 Difference between Production Lead Time (P) and Delivery Lead Time (D) Operation ASSEMBLE TO ORDER Order Purchase Make Assemble Deliver D P Compare CODP = KOOP Page 277 Operations Management, 5E: Chapter 10,11 en12 2 5 Difference between Production Lead Time (P) and Delivery Lead Time (D) P:D ratios Customer orders Obtain resources Produce product / service Make to stock Deliver to customer Produce to stock D P Part produce to order D P Make to order Produce to order D P Resource to order D P Resource to order Operations Management, 5E: Chapter 10,11 en12 Page 277 Finite and infinite loading of jobs on three work centres A, B and C 6 Finite loading limits the loading on each centre to their capacities, even if it means that jobs will be late. Infinite loading allows the loading on each centre to exceed their capacities to ensure that jobs will not be late Infinite loading Finite loading 0 4 3 2 1 5 A B Work centre Page 279 C A B Work centre C 6 Operations Management, 5E: Chapter 10,11 en12 3 7 Capacity and load are not always in balance Operations Management, 5E: Chapter 10,11 en12 8 The hospital triage system In Accident and Emergency departments, patients arrive at random. Medical staff must rapidly devise a schedule: 1. Patients with serious illness need urgent attention. 2. Less urgent cases will have to wait. 3. Routine non-urgent cases will have the lowest priority of all. See article about van Houdenhoven Page 281 Operations Management, 5E: Chapter 10,11 en12 4 Gantt chart showing the schedule for jobs at each process stage 9 Week 12 Process stage Week 13 Initial spec. Job A Job B Pre-coding Job W Job X Coding Compact. check Job A Job Z Job C Week 18 Job D Job B Job E Job D Job C Job B Job A Job C Job B Job A Job X Job Y Job A Job B Operations Management, 5E: Chapter 10,11 en12 Page 286 Shift allocation for the technical ‘hotline’: (a) on a daily basis; (b) on a weekly basis 10 Mon Number of staff required Peter Walter Marie 04:00 Week 17 Week 16 Week 15 Job X Job Y Final test Week 14 08:00 Jo Claire 12:00 16:00 Shift pattern (24-hour clock) (a) Page 288 Jo Jo Tue 3 5 Wed 5 Thu 5 Fri Sat 3 Sun 2 2 Peter X X X X O O X Marie X X X X X O O Claire X X X X O O X Walter O X X X X X O Jo O X X O X X X 20:00 X Full day O Day off (b) Operations Management, 5E: Chapter 10,11 en12 5 11 Pull and push philosophies of planning and control PUSH CONTROL FORECAST CENTRAL OPS. PLANNING AND CONTROL SYSTEM OR Instruction on what to make and where to send it Work centre Work centre Work centre DEMAND Work centre See also chapter 14 Operations Management, 5E: Chapter 10,11 en12 Page 290 12 Pull and push philosophies of planning and control PULL CONTROL Work centre Work centre Delivery Page 290 Work centre Delivery Request Request Request Request Work centre Delivery DEMAND Delivery Operations Management, 5E: Chapter 10,11 en12 6 13 Push versus Pull explained Operations Management, 5E: Chapter 10,11 en12 Page 290 14 The drum, buffer, rope, concept Buffer of inventory Stage or process A Stage or process B Stage or process C Communication rope controls prior activities Bottleneck drum sets the beat Page 291 Stage or process D Stage or process E Operations Management, 5E: Chapter 10,11 en12 7 15 Operations Management, 5E: Chapter 10,11 en12 16 Bottleneck/niet-bottleneck concept Een bottleneck is die capaciteitsbron waarvan de capaciteit kleiner is dan of gelijk is aan de capaciteitsbehoefte ten gevolge van de marktvraag. Een niet-bottleneck heeft een zekere overcapaciteit. Maak de niet-bottlenecks ondergeschikt aan de bottlenecks. Operations Management, 5E: Chapter 10,11 en12 8 17 Bottleneck-management 1. Ontdek de bottleneck 2. Maximaliseer de output van de bottleneck 3. Maak alles afhankelijk van de bottleneck 4. Hef de bottleneck op 5. Ga terug naar 1 Voorkom dat traagheid (inertie) de bottleneck wordt. Operations Management, 5E: Chapter 10,11 en12 18 Operations Management, 5E: Chapter 10,11 en12 9 19 10 The nature of Planning and Control 11 Capacity Planning and Control 12 Inventory Planning and Control Capacity planning and control Supply The operation Demand Availability of capacity to deliver products and services Operations resources Page 297 20 Required availability of products and services The market Customer requirements Operations Management, 5E: Chapter 10,11 en12 Objectives of capacity planning and control Measure aggregate capacity and demand Aggregated output Identify the alternative capacity plans Choose the most appropriate capacity plan Forecast demand Estimate of current capacity Time Page 301 Operations Management, 5E: Chapter 10,11 en12 10 Capacity versus Load 21 Outsourcing? Turnover in man hours Capacity Load 1/1 Spring Winter Summer Autumn 31/12 Time in quarterlies Operations Management, 5E: Chapter 10,11 en12 22 Causes of seasonality Climatic Festive Behavioural Political Financial Social Source: Alamy/Medical-on-line Construction materials Travel services Beverages (beer, cola) Holidays Foods (ice-cream, Christmas cake) Tax processing Clothing (swimwear, shoes) Doctors (influenza epidemic) Gardening items (seeds, fertilizer) Sports services Fireworks Education services Page 326 Operations Management, 5E: Chapter 10,11 en12 11 23 How capacity and demand are measured Efficiency = Planned loss of 59 hours Design capacity Avoidable loss – 58 hours per week Effective capacity 109 hours per week 168 hours per week Utilization= Actual output – 51 hours per week Actual output Design capacity Operations Management, 5E: Chapter 10,11 en12 Page 274 24 Actual output Effective capacity Ways of reconciling capacity and demand Demand Capacity Level capacity Page 333 Demand Demand Capacity Chase demand Capacity Demand management Operations Management, 5E: Chapter 10,11 en12 12 Cumulative representations 25 Capacity and demand Cumulative demand Cumulative capacity Unable to meet orders Building stock Time Operations Management, 5E: Chapter 10,11 en12 Page 319 Z-graphic 26 Lead time Time Cumu lative Lead time In Stock level Out Time Stock level Time Operations Management, 5E: Chapter 10,11 en12 13 Simple queuing system 27 Server 1 Distribution of processing times Distribution of arrival times Rejecting Balking Reneging Server 2 Source of customers Boundary of system Page 323 28 Served customers Queue or ‘waiting line’ Server m Operations Management, 5E: Chapter 10,11 en12 Simple queuing system Low variability – narrow distribution of process times Time High variability – wide distribution of process times Time Page 335 Operations Management, 5E: Chapter 10,11 en12 14 29 10 The nature of Planning and Control 11 Capacity Planning and Control 12 Inventory Planning and Control Inventory planning and control Supply Demand The operation Operations resources Delivery of products and services when required Need for products and services at a particular time Customer requirements Operations Management, 5E: Chapter 10,11 en12 Page 340 30 The market Inventory is created to compensate for the differences in timing between supply and demand Rate of supply from input process Source: Alamy/Van Hilversum Rate of demand from output process Inventory Input process Output process Inventory Page 343 Operations Management, 5E: Chapter 10,11 en12 15 Two alternative inventory plans with different order quantities (Q) 31 Inventory level Demand (D) = 1000 items per year 400 Plan A Q = 400 Average inventory for plan A = 200 Plan B 100 Q = 100 Average inventory for plan B = 50 Time 0.1 yr 0.4 yr Operations Management, 5E: Chapter 10,11 en12 Page 375 32 Traditional view of inventory-related costs 400 350 300 Total costs Costs 250 200 150 Holding costs 100 Order costs 50 Economic order quantity (EOQ) 50 Page 350 100 150 200 250 Order quantity 300 350 400 Operations Management, 5E: Chapter 10,11 en12 16 33 If the true costs of stock holding are taken, the economic order quantity, the real EOQ, is much smaller 400 Revised total costs 350 Revised holding costs 300 Costs 250 Original total costs 200 150 Original holding costs 100 Order costs 50 Revised EOQ 100 50 Original EOQ 200 250 150 Order quantity 350 400 Operations Management, 5E: Chapter 10,11 en12 Page 356 34 300 The ‘two-bin’ and ‘three-bin’ re-ordering systems Two-bin system Bin 1 Bin 2 Items being Re-order level + safety used inventory Page 362 Three-bin system Bin 1 Items being used Bin 2 Bin 3 Re-order level inventory Safety inventory Operations Management, 5E: Chapter 10,11 en12 17 35 Pak het kleurrijk aan Operations Management, 5E: Chapter 10,11 en12 36 Iedereen snapt dit Operations Management, 5E: Chapter 10,11 en12 18 37 Pareto curve for stocked items Percentage of value of items 100 90 80 70 60 50 40 30 Class A items Class B items Class C items 20 10 10 20 30 40 50 60 70 80 90 100 Percentage of types of items Operations Management, 5E: Chapter 10,11 en12 Page 364 38 Inventory classifications and measures Class A items – the 20% or so of high-value items which account for around 80% of the total stock value Class B items – the next 30% or so of medium-value items which account for around 10% of the total stock value Class C items – the remaining 50% or so of low-value items which account for around the last 10% of the total stock value Operations Management, 5E: Chapter 10,11 en12 19


