10-14 & 10-21 (2)
Problem 10-14 (30 minutes)
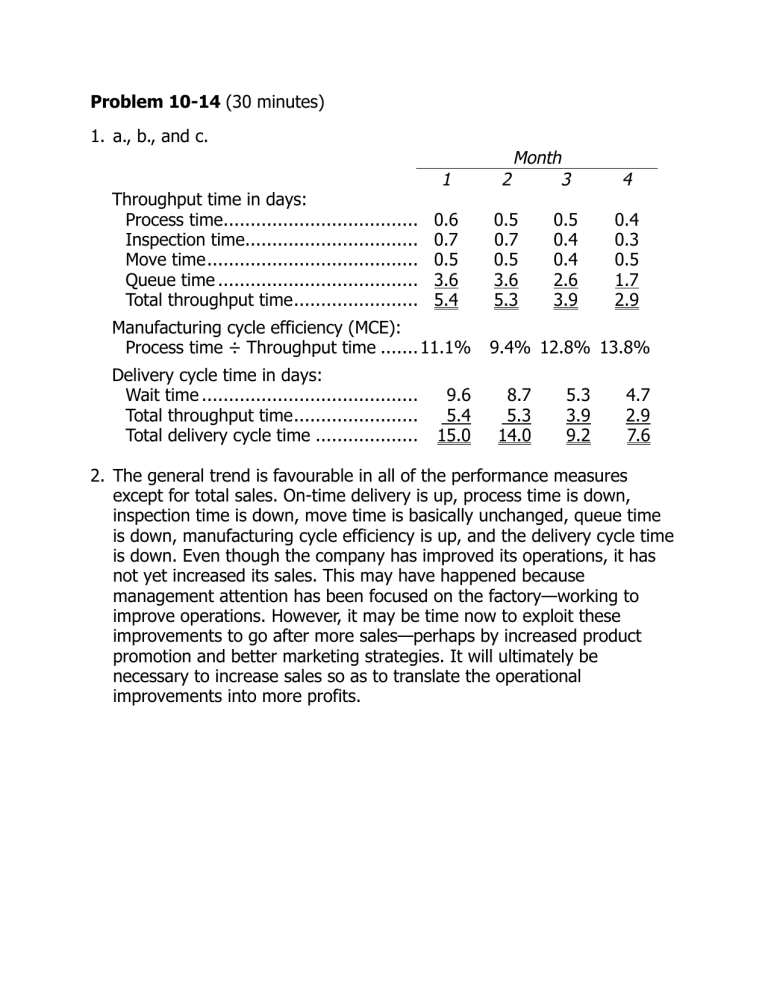
1. a., b., and c.
1
Throughput time in days:
Process time.................................... 0.6
Inspection time................................ 0.7
Move time....................................... 0.5
Queue time ..................................... 3.6
Total throughput time....................... 5.4
2
0.5
0.7
0.5
3.6
5.3
Month
3
0.5
0.4
0.4
2.6
3.9
4
0.4
0.3
0.5
1.7
2.9
Manufacturing cycle efficiency (MCE):
Process time ÷ Throughput time .......11.1% 9.4% 12.8% 13.8%
Delivery cycle time in days:
Wait time ........................................
9.6
8.7
Total throughput time.......................
5.4
5.3
Total delivery cycle time ................... 15.0
14.0
5.3
3.9
9.2
4.7
2.9
7.6
2. The general trend is favourable in all of the performance measures except for total sales. On-time delivery is up, process time is down, inspection time is down, move time is basically unchanged, queue time is down, manufacturing cycle efficiency is up, and the delivery cycle time is down. Even though the company has improved its operations, it has not yet increased its sales. This may have happened because management attention has been focused on the factory—working to improve operations. However, it may be time now to exploit these improvements to go after more sales—perhaps by increased product promotion and better marketing strategies. It will ultimately be necessary to increase sales so as to translate the operational improvements into more profits.
Problem 10-14 (continued)
3. a. and b.
5
Throughput time in days:
Process time.........................................
0.4
Inspection time.....................................
0.3
Move time............................................
0.5
Queue time ..........................................
Total throughput time............................
1.2
Month
6
0.4
0.5
0.9
Manufacturing cycle efficiency (MCE):
Process time ÷ Throughput time ............ 33.3% 44.4%
As a company pares away non-value-added activities, the manufacturing cycle efficiency improves. The goal, of course, is to have an efficiency of
100%. This will be achieved when all non-value-added activities have been eliminated and process time equals throughput time.
10-21 b. Labour efficiency variance:
[91,000 hrs – (50 hours ÷ 100 litres _ 175,000)] _ $15.00= $52,500U
The supervisor could argue (reasonably) that this variance was caused by having to handle 12,500 additional litres of raw material (275,000 –
262,500). Since 50 hours are required per 100 litres of good output and
150 litres of raw material are required per 100 litres of good output, each litre of raw material handled takes .333 hours. The efficiency variance related to this then is: 12,500 x .333 x $15 per hour = $62,427 u. This suggests that the supervisor of the production employees did a good job since the variance due to the excess usage of raw materials exceeds the net efficiency variance calculated above.


