princples of economics lab – elasticity & excel
advertisement

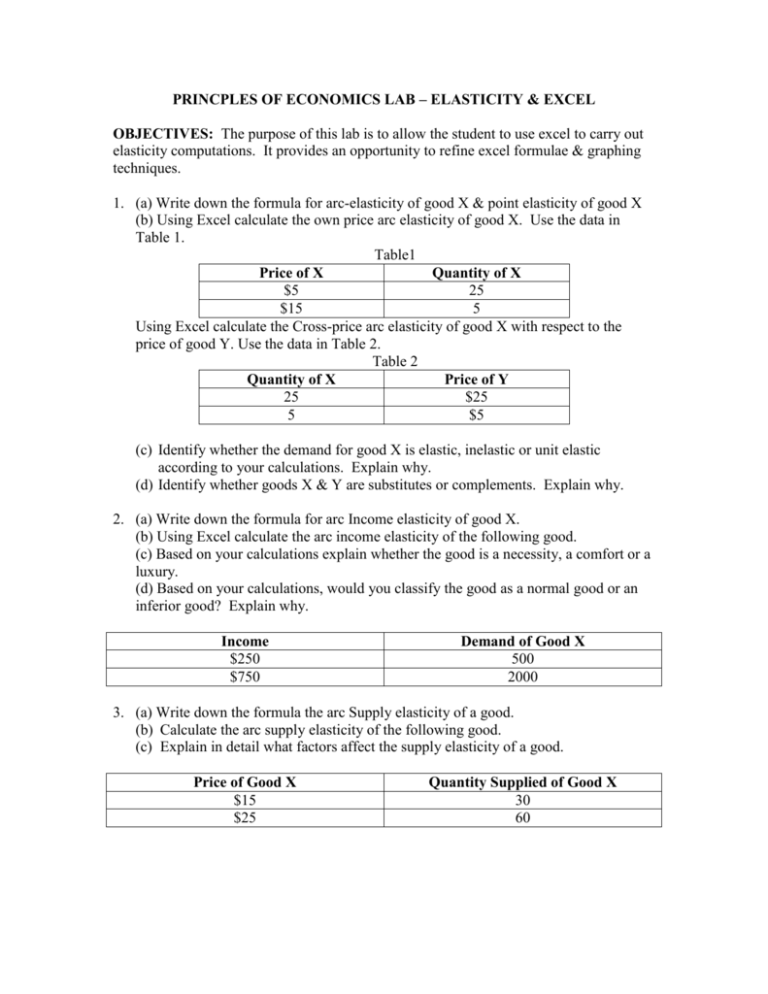
PRINCPLES OF ECONOMICS LAB – ELASTICITY & EXCEL OBJECTIVES: The purpose of this lab is to allow the student to use excel to carry out elasticity computations. It provides an opportunity to refine excel formulae & graphing techniques. 1. (a) Write down the formula for arc-elasticity of good X & point elasticity of good X (b) Using Excel calculate the own price arc elasticity of good X. Use the data in Table 1. Table1 Price of X Quantity of X $5 25 $15 5 Using Excel calculate the Cross-price arc elasticity of good X with respect to the price of good Y. Use the data in Table 2. Table 2 Quantity of X Price of Y 25 $25 5 $5 (c) Identify whether the demand for good X is elastic, inelastic or unit elastic according to your calculations. Explain why. (d) Identify whether goods X & Y are substitutes or complements. Explain why. 2. (a) Write down the formula for arc Income elasticity of good X. (b) Using Excel calculate the arc income elasticity of the following good. (c) Based on your calculations explain whether the good is a necessity, a comfort or a luxury. (d) Based on your calculations, would you classify the good as a normal good or an inferior good? Explain why. Income $250 $750 Demand of Good X 500 2000 3. (a) Write down the formula the arc Supply elasticity of a good. (b) Calculate the arc supply elasticity of the following good. (c) Explain in detail what factors affect the supply elasticity of a good. Price of Good X $15 $25 Quantity Supplied of Good X 30 60 4. Consider the following demand function: Q = 5 – (1/2) P (a) Using excel calculate values for Q when you make up values for P. Use the following values for P: 0,1,2,3,4,…10. (b) Using excel plot the demand curve (with P on the vertical axis & Q on the horizontal axis). (c) Using Excel, calculate the values of own-price point elasticity at the end points and the mid-point of the demand curve. Do these values agree with what you learned in class? 5. Consider the following demand function: Q 5P 2 (d) Using excel calculate values for Q when you make up values for P. Use the following values for P: 1, 1.5, 2, 2.5, 3, 4, 5, 6, 7, 8, 9, 10, …..,16, 17. A. Using excel plot the demand curve (with P on the vertical axis & Q on the horizontal axis).


