Histograms - Suffolk Maths
advertisement
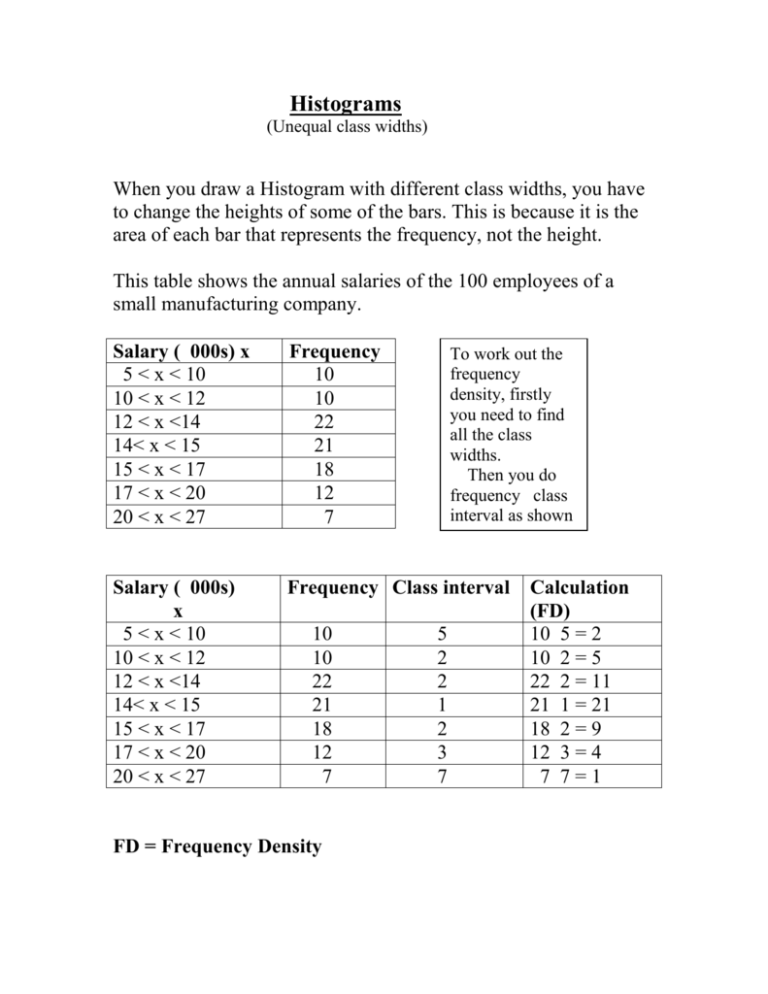
Histograms (Unequal class widths) When you draw a Histogram with different class widths, you have to change the heights of some of the bars. This is because it is the area of each bar that represents the frequency, not the height. This table shows the annual salaries of the 100 employees of a small manufacturing company. Salary ( 000s) x 5 < x < 10 10 < x < 12 12 < x <14 14< x < 15 15 < x < 17 17 < x < 20 20 < x < 27 Frequency 10 10 22 21 18 12 7 Salary ( 000s) x 5 < x < 10 10 < x < 12 12 < x <14 14< x < 15 15 < x < 17 17 < x < 20 20 < x < 27 Frequency Class interval 10 10 22 21 18 12 7 FD = Frequency Density To work out the frequency density, firstly you need to find all the class widths. Then you do frequency class interval as shown below 5 2 2 1 2 3 7 Calculation (FD) 10 5 = 2 10 2 = 5 22 2 = 11 21 1 = 21 18 2 = 9 12 3 = 4 7 7=1 Finding the modal group T o find the modal group use the tallest bar, then from each top corner draw a straight diagonal line down to the corners of the neighboring bars as shown. Draw a line from where the two lines meet to the X axis – in this case, modal = 9.5 Modal class for distribution To work out modal classes for certain distributions, you just find the tallest bar, in this case the modal class = 14 < x < 15 Question Gavin records the waiting times of a group of patients at a dentist. The waiting times are shown in the table. Waiting time (mins) t Frequency Class width 0<t<2 8 2<t<6 12 6<t<8 14 8 < t < 14 4 Frequency Density Complete the table, draw a histogram showing your results and work out the modal group. Answer to question 7 6 5 4 3 2 1 0 0 2 4 6 8 10 12 14 Waiting time (mins) t Frequency Class width Frequency Density 0<t<2 8 2 4 2<t<6 12 4 3 6<t<8 14 2 7 8 < t < 14 4 6 2/3


