chapter 7 – regression quiz
advertisement
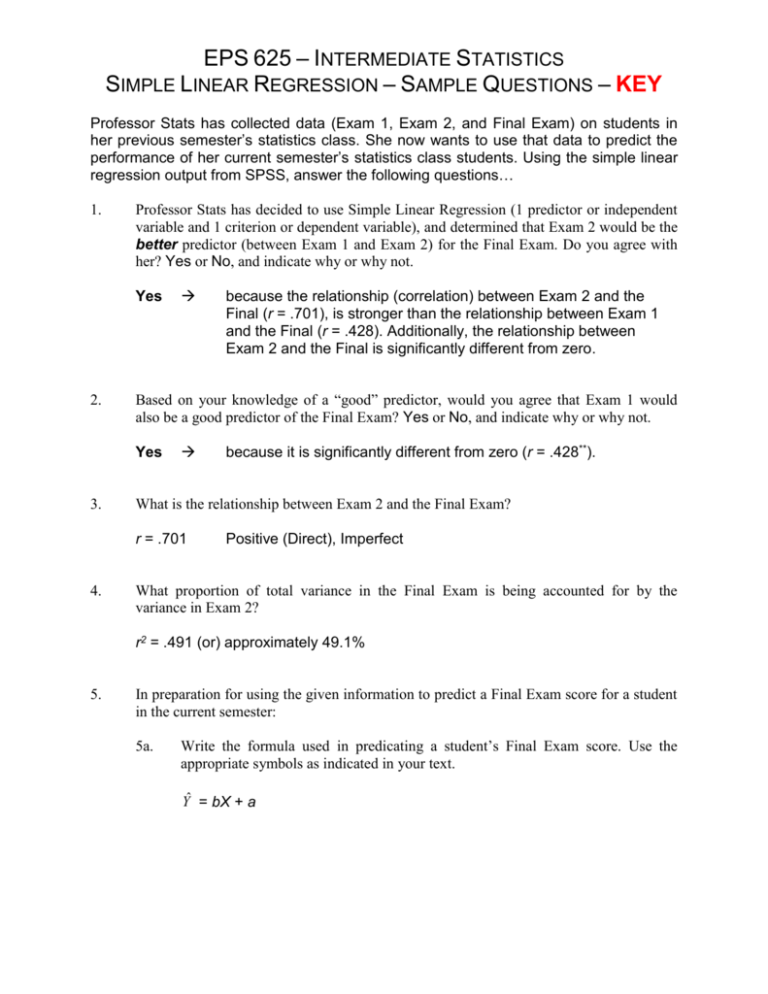
EPS 625 – INTERMEDIATE STATISTICS SIMPLE LINEAR REGRESSION – SAMPLE QUESTIONS – KEY Professor Stats has collected data (Exam 1, Exam 2, and Final Exam) on students in her previous semester’s statistics class. She now wants to use that data to predict the performance of her current semester’s statistics class students. Using the simple linear regression output from SPSS, answer the following questions… 1. Professor Stats has decided to use Simple Linear Regression (1 predictor or independent variable and 1 criterion or dependent variable), and determined that Exam 2 would be the better predictor (between Exam 1 and Exam 2) for the Final Exam. Do you agree with her? Yes or No, and indicate why or why not. Yes 2. because it is significantly different from zero (r = .428**). What is the relationship between Exam 2 and the Final Exam? r = .701 4. because the relationship (correlation) between Exam 2 and the Final (r = .701), is stronger than the relationship between Exam 1 and the Final (r = .428). Additionally, the relationship between Exam 2 and the Final is significantly different from zero. Based on your knowledge of a “good” predictor, would you agree that Exam 1 would also be a good predictor of the Final Exam? Yes or No, and indicate why or why not. Yes 3. Positive (Direct), Imperfect What proportion of total variance in the Final Exam is being accounted for by the variance in Exam 2? r2 = .491 (or) approximately 49.1% 5. In preparation for using the given information to predict a Final Exam score for a student in the current semester: 5a. Write the formula used in predicating a student’s Final Exam score. Use the appropriate symbols as indicated in your text. Yˆ = bX + a EPS 625 – INTERMEDIATE STATISTICS SIMPLE LINEAR REGRESSION – SAMPLE QUESTIONS – KEY 5b. What is the numeric value of the regression constant? a = 47.432 5c. What is the numeric value of the regression coefficient? b = .518 6. Using the formula from question 4a. – and knowing that a current student has made an 80 on Exam 2, what would you predict their score to be on the Final Exam? Y’ = bX + a Y’ = .518(80) + 47.432 Y’ = 41.44 + 47.432 Y’ = 88.892 (89) 7. What is the degree of error associated with this regression analysis? 7.565 standard deviations
