Exhibit B - Utah Public Service Commission
advertisement
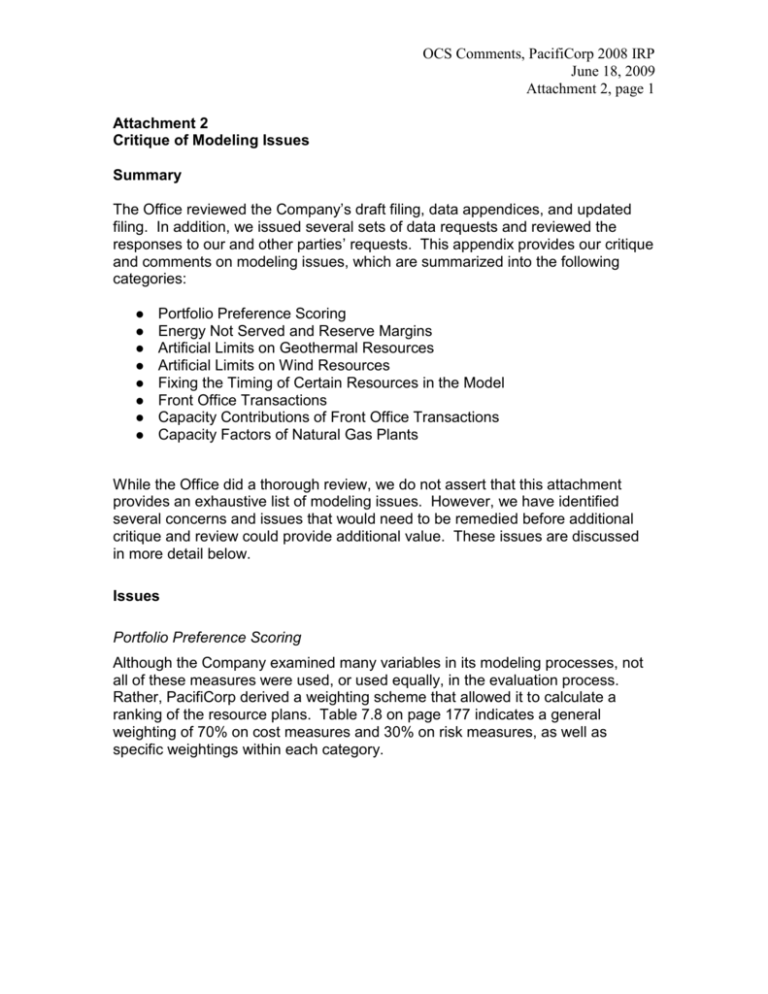
OCS Comments, PacifiCorp 2008 IRP June 18, 2009 Attachment 2, page 1 Attachment 2 Critique of Modeling Issues Summary The Office reviewed the Company’s draft filing, data appendices, and updated filing. In addition, we issued several sets of data requests and reviewed the responses to our and other parties’ requests. This appendix provides our critique and comments on modeling issues, which are summarized into the following categories: Portfolio Preference Scoring Energy Not Served and Reserve Margins Artificial Limits on Geothermal Resources Artificial Limits on Wind Resources Fixing the Timing of Certain Resources in the Model Front Office Transactions Capacity Contributions of Front Office Transactions Capacity Factors of Natural Gas Plants While the Office did a thorough review, we do not assert that this attachment provides an exhaustive list of modeling issues. However, we have identified several concerns and issues that would need to be remedied before additional critique and review could provide additional value. These issues are discussed in more detail below. Issues Portfolio Preference Scoring Although the Company examined many variables in its modeling processes, not all of these measures were used, or used equally, in the evaluation process. Rather, PacifiCorp derived a weighting scheme that allowed it to calculate a ranking of the resource plans. Table 7.8 on page 177 indicates a general weighting of 70% on cost measures and 30% on risk measures, as well as specific weightings within each category. OCS Comments, PacifiCorp 2008 IRP June 18, 2009 Attachment 2, page 2 Table 7.8 – Measure Importance Weights for Portfolio Ranking Cost Measures Risk-adjusted PVRR Customer Rate Impact Capital Cost for 2009-2018 Risk Measures CO2 Cost Exposure Production Cost Standard Deviation Average annual ENS Average Annual Probability of ENS events for July exceeding 25 GWh Total Weight 45% 20% 5% Weight 15% 5% 5% 5% 100% The Company discussed the weighting factors in earlier stakeholder meetings. However, even at that time, parties raised questions about doing sensitivity analysis to see how plans perform under different weighting of cost and risk. The Company has not provided additional support for the use of this particular weighting structure. Commission guidance on this issue would be helpful for future IRP filings. It should be noted that the preferred portfolio could very easily change if the preference scoring used different variables or different weights, in particular given the close performance of Cases 5 and 8. In fact, in Chapter 8 the Company did make a slight change to the weighting factors, and found that in the $45/Ton CO2 analysis, Portfolio 8 and Portfolio 5 reversed position in the ranking. If the weighting was changed in the assessment of the B series cases, a similar outcome may result. This weighting issue has broader implications than just the theoretical. Specifically, the unsupported portfolio preference scoring calls into question the selection of 5b CCCT Wet as the preferred portfolio and indicates that wind resources may be understated (as additional wind is the primary difference between cases 5 and 8.) Energy Not Served & Reserve Margins In its 2007 IRP, PacifiCorp concluded that its System maintains the appropriate level of reliability by relying on a 12% reserve margin. In its Order on the 2007 IRP, the Commission stated that a 15% PRM appears reasonable at this time for resource planning purposes.1 It directed the Company to analyze cost-risk tradeoffs in future IRPs based on different PRM levels. The Company's analysis of 12% versus 15% PRM levels is conducted on pages 218-221 of the IRP and involves cases under different CO2 tax assumptions ($45, $70 and $100). In comparing Case 8 (12%) with Case 41 (15%) at a CO2 tax of $45/ton, the increase in the PVRR is about $321 million. The cost-risk tradeoff for these two 1 Commission Order, Docket No. 07-2035-01, pg. 16. OCS Comments, PacifiCorp 2008 IRP June 18, 2009 Attachment 2, page 3 cases, as constructed by the Company, is presented in Table 8.18. This analysis shows a cost premium of $659/MWh results when moving from a 12% to 15% PRM and leads the Company to conclude: “[Assuming CO2 tax assumptions less than $70/ton]…from a stochastic modeling perspective, it is not cost-effective to invest in incremental generating capacity for reserves given that the cost premium for such investment is above the assumed ENS cost.” (pg. 221) The Office has concerns about the Company’s cost-risk analysis because the Energy Not Served (ENS) cost as a percentage of total variable costs has been reduced by the Company’s declining block approach for valuing ENS. In prior IRPs, PacifiCorp used a flat ENS cost (the FERC cap price) as a proxy for buying emergency power. Thus, it anticipated paying a high premium for emergency power as is standard industry practice. By using a declining block cost structure --$400/MWh for the first 50 GWh/yr., $200/MWh for the next 100 GWh/yr. and $100/MWh for all amounts over 150 GWh/yr.—the Company appears to have biased the results in its cost-risk analysis. At a minimum, the Company should provide additional sensitivity analysis on PRM using a flat ENS cost at different cost levels ($400, $300, etc.) so that it can compare the results of the standard industry approach for valuing ENS with the Company’s tiered method for valuing ENS. In addition, the Office is concerned about this cavalier approach toward the issue of ENS. It appears that the Company's preference to spending $659/MWh is to simply leave the energy as unserved. Absent additional explanation, we question whether subjecting Utah customers to rolling blackouts because of the costs of the alternatives represents good public policy. The Office believes that a better approach needs to be used in the valuation of ENS. The Office also believes that a better approach needs to be used in the evaluation of reserve requirement. For example, the Company could compare the costs and risk profile of the portfolio – including appropriate costs assigned to ENS – with another portfolio with identical input assumptions designed as a capacity expansion for the higher target level of 15% reserve requirements. Several cases designed this way could give adequate cost and risk information upon which to base the Company's reserve requirement decision. Typically, utilities determine system reliability by conducting loss of load probability studies, and they rely on the industry standard criteria that the utility system should be planned such that it will experience no more than 1 day of outages in 10 years, or 2.4 hours per year. For example, the following link is to a recent study (December 12, 2008) performed by the same model vendor that supplies software to PacifiCorp, Ventyx, using the same modeling tools that PacifiCorp used in this IRP, the PaR model, and conducted for a neighboring utility, Public Service Company of Colorado. OCS Comments, PacifiCorp 2008 IRP June 18, 2009 Attachment 2, page 4 http://www.xcelenergy.com/SiteCollectionDocuments/docs/CRPReserveMarginSt udy.pdf The results of that study conclude that the appropriate level of reliability to achieve a 1 day in 10 year reliability criteria is a 16.3% reserve margin. The Office notes that many factors cause the reliability of one utility system to be different from another and is not advocating the use of this study as a proxy. In fact, we note the Company’s intent to include its own loss of load probability study in the next IRP. However, it is unacceptable for the Company to impose the unmeasured risk of planning to an unreasonably low reserve margin level for two planning cycles before including the new analysis. Artificial Limits on Geothermal Resources The Office is very concerned about the extremely low capacity limit placed on geothermal resources in the System Optimizer Model. The Company limits geothermal options to three 35-MW projects for a total of 105 MW over the 20year planning horizon. This is particularly inexplicable at a time when the Company plans to substantially expand its transmission system by 3,000 MWs via the Gateway West and Gateway South projects, to access new resources. On page 117 of the IRP the Company states in defense of these capacity limits: “The Company has not yet conducted a geothermal commercial potential study looking at long-term prospects for geothermal energy utilizing both the Blundell technology and other alternative geothermal technologies. One of the fundamental barriers to geothermal development is the difficulty in characterizing the type, quality, and conditions of a particular geothermal resource. This characterization requires a significant investment for well drilling and testing in order to develop a reliable and proven assessment.” The Company recently contracted with WorleyParsons Group to “conduct a highlevel renewable generation study for solar, biomass and geothermal” (Pg 98) and the Company apparently adjusted the cost estimate furnished by WorleyParsons to be consistent with the projected costs for the third unit expansion at the Blundell geothermal plant. However, the contract did not call for WorleyParsons to perform a commercial study of specific sites for potential development of geothermal resources.2 PacifiCorp’s response to CCS DR 3.3(b). The Office further notes that the WorleyParsons Group Study was provided by PacifiCorp in response to CCS DR 3.3(a). The Office has reviewed the Study and we concur with the Company that an assessment of the commercial feasibility of geothermal resources is beyond the scope of the Study. 2 OCS Comments, PacifiCorp 2008 IRP June 18, 2009 Attachment 2, page 5 The Office further notes that geothermal resources are selected in most of the core case runs and generally desired when the resource is initially available (2013). Thus, geothermal resources, as modeled in System Optimizer, tend to be a cost-effective option. Regarding the potential for geothermal development in PacifiCorp’s service territory, the Office believes that two recent sources, a UAE Conference presentation (May 14, 2009) by J. Jason Berry, Manager of the Utah State Energy Program, on findings related to Utah Renewable Energy Zones (REZ) and a 2008 geothermal resource assessment made by the U.S. Geological Survey (USGS), are instructive and point to the need for a more in-depth commercial study. In his presentation, Mr. Berry estimated the overall geothermal resource potential in Utah at 2,166 MWs, with a near-term potential of 700 MWs. The 2008 USGS Study categorizes geothermal resource potential by identified resources, undiscovered resources and enhanced geothermal systems. At a 95% confidence level USGS estimates the “identified” geothermal resource potential for Utah at 334 MWs and for Oregon at 432 MWs. At a 50% confidence level the estimates rise for Utah to 1,088 MWs and for Oregon to 1,406 MWs. The above information strongly suggests that PacifiCorp has understated the geothermal resource potential in the 2008 IRP and should commit to conduct a comprehensive study on the near- and long-term commercial feasibility of geothermal resources within or adjacent to its service territory. Artificial limits on Wind Resources The Committee notes that the wind potential over the 20-year planning horizon totals approximately 13,000 MWs (see Table 6.11), but only 1,863 MWs of wind resources are included in the preferred portfolio (5b CCCT Wet). The Company places annual limits on wind capacity in the System Optimizer model such that annual wind additions are capped at 500 MW in years prior to 2014 and 750 MW in 2014 and thereafter. If this limit had been greater or even eliminated, then the model may have selected more wind in certain portfolios. This kind of artificial limit must be described and justified by the Company. If exogenously imposed constraints (such as this limit on wind resources) produce significantly different results, the Company should pursue additional runs as a sensitivity analysis to examine the potential lost benefits associated with the constraint. The Office also notes that the Company used a wind integration cost of $11.75/MWh based on a recent Portland General Study. This is more than double the $4.60 used by PacifiCorp in its last IRP and significantly more than OCS Comments, PacifiCorp 2008 IRP June 18, 2009 Attachment 2, page 6 most integration studies.3 For example, a DOE report entitled 20% Wind Energy by 2030 Report4 contains wind integration costs taken from a series of nine studies that were conducted between May 2003 and April 2006, and all of the studies indicate that wind integration costs would be less than $5/MWh. The Company should provide additional support before using integration costs that are so substantially higher than those used in its last IRP and those calculated by a majority of studies.5 In summary, the Office is concerned that the Company may have pre-specified the amount of wind it was operationally comfortable acquiring in the planning horizon and backed into a combination of inputs that generated the desired outcome. This observation is confirmed in part by the statement made by the Company on page 231 regarding Case 8: “A disadvantage for case 8 is the amount of wind investment in the first 10 years, which reaches 2,600 MWs. The average annual capacity added for 2012-2018 exceeds 300 MW, which is a concern from procurement, rate impact, construction project management, and operational perspectives. This wind is not needed for RPS compliance purposes, and its economic desirability hinges on continuation of a production tax credit (or comparable financial incentive), a significant CO2 cost penalty benefiting clean energy alternatives, and a robust market for sales of robust energy, particularly during off-peak hours…The respective wind expansions patterns for cases 5 and 8 suggest that the optimal wind strategy is to identify a wind capacity floor and upper value that are updated as aspects of future federal CO2 compliance cost and renewable energy policies become clearer.” The Company must be required to support the exogenous constraints imposed upon the model. Absent greater demonstration that these constraints are based upon real and verifiable practical concerns, it again leads to the conclusion that wind has been underselected in the preferred portfolio. 3 The Office is aware of one other study that supported a value similar to $11.75/MWH also. It was conducted by a University of Texas Professor named Ross Baldick in the Electrical and Computer Engineering department, who concluded that $10/MWh would be a reasonable cost for wind power integration. However, integration costs in this range are not typical results. 4 See Table 4.1 in Chapter 4(www.20percentwind.org). 5 The Office notes that the Company included its updated wind integration in its filing on May 28. It is interesting that their costs were within a few cents of the Portland General study. The Office has not thoroughly reviewed this study – which should have been done as an input to the IRP and not as a follow up – and may comment further on the issue in its reply comments. OCS Comments, PacifiCorp 2008 IRP June 18, 2009 Attachment 2, page 7 Fixing the Timing of Certain Resources in the Model The original set of 48 cases6 for the 2008 IRP were run with Lakeside 2 included in the existing load and resource balance. The preferred portfolio selected by PacifiCorp given these original cases would have been Case 5. On February 19, 2009 the Company cancelled the Lakeside 2 contract, which resulted in a delay in the IRP filing so the Company could develop 10 additional cases to analyze. Moreover, out of these 10 new cases, the System Optimizer model was only allowed to freely select resources in eight cases; two cases involved scenarios where certain natural gas resources were hard fixed in the model. Thus, the original 48 cases were narrowed to only 10 cases in the process of selecting a preferred portfolio and in two of the cases natural gas resources were hard fixed in the model. The Company selected a preferred portfolio, 5b CCCT Wet, that includes two natural gas resources fixed in the analysis: a 570 MW CCCT in 2014 and a 261 MW SCCT. The Company explains that these natural gas resources provide flexibility to support expansion of renewables and meet base/intermediate load requirements. This explanation may be true, but it calls into question the very purpose of the IRP modeling efforts. Specifically, what is the value of the significant modeling updates and improvements made in this round of the IRP, if ultimately the preferred portfolio is determined primarily by resources hard fixed and supplemented by market purchases? If the Company has strong, defensible reasons for hard fixing resources, those should be identified, explained thoroughly, and included as inputs before the remainder of the analysis is completed. If indeed these resources are defensible, the results of cost and risk analysis should be instructive in demonstrating the benefits. The Office has one other concern about what appears to be yet another resource fixed in the Company's analysis. In its IRP modeling the Company assumes that it can economically acquire 201 MWs in 2012 on the Eastside of the system, under a long-term firm (LTF) PPA. In response to CCS DR 3.9(a), the Company states approximately 300 MW of merchant plant capacity is potentially available to the Company and of that total, (1) 200 MW is a merchant gas plant that currently does not have a long-term contract; (2) an indicative price offer was provided last year by the owners of the facility; and (3) this indicative price was used as the reference cost for the 201 MW LTF option in the 2008 IRP. The Office has two significant concerns related to the 201 MW PPA. First, the Company’s response to CCS 3.9 suggests that the 201 MW PPA is hard fixed in the model in the year 2012 in both the original and B series IRP runs. According to the Company’s response to CCS 3.9(a), PacifiCorp did perform sensitivity 6 The 48 cases are comprised of 29 core cases, 17 sensitivity cases and two cases based on the 2009 Business Plan resource additions. OCS Comments, PacifiCorp 2008 IRP June 18, 2009 Attachment 2, page 8 tests treating the 201 MW PPA as a resource option and allowing System Optimizer to select the resource in any given year. However, it appears these sensitivity tests may have been limited to the Case 5 assumptions (the original preferred portfolio). Second, certainty relating to the availability and cost of the potential resources underlying the 201 MW PPA appears to be a significant issue that is simply assumed away in the Company’s analysis. If the Company is unable to negotiate economic PPAs with potential sellers of merchant power by 2012, then the reliance on FOTs would correspondingly increase by 201 MWs. This risk needs to be fully understood and the Company should clarify in its reply comments whether the 201 MW PPA was made available as a potential resource option in all deterministic cases, or whether System Optimizer was only allowed to select the 201 MW PPA in a limited number of cases. The Company should also outline contingency plans and trigger points relating to the 201 MW PPA. Front Office Transactions The termination of significant LTF contracts totaling 1011 MWs7 by summer 2012, along with lost hydro generation due to re-licensing activities, partially drives a rapidly growing deficit position on the PacifiCorp system of approximately 1,936 MWs by 2012. PacifiCorp plans to cover a significant percentage of this deficit with front office transactions (FOT). While the heavy reliance on FOTs is especially apparent in the “bridging” years of 2012 and 2013, the dominance of FOTs in the resource planning strategy encompasses the entirety of the planning horizon. The following table shows cumulative capacity additions by year between 2009 and 2018, and it indicates that FOTs will dominate the capacity additions that will be made during that period. 7 The key LTF contract expiring in that period is the BPA contract at 575 MW. A list of major contracts expiring in the 2011-2012 period is provided in the IRP on page 84. OCS Comments, PacifiCorp 2008 IRP June 18, 2009 Attachment 2, page 9 It should also be pointed out that while cumulative additions of FOTs dominate the portfolio additions in the first five years, by 2018, the role of FOTs is somewhat mitigated by all the other types of resources that are also added. The office is also concerned by the amount of Front Office Transactions that the Company plans to make on the West side of the System. The following compares the amount of FOTs on the East and West sides of the System in the Preferred Portfolio: East and West Side Front Office Transaction Additions (MW) East West System East West 2009 2010 2011 2012 2013 2014 2015 2016 2017 2018 75 50 150 59 394 839 493 839 200 739 202 739 228 689 717 289 800 582 75 50 209 1233 1332 939 941 917 1006 1382 100.0% 0.0% 100.0% 0.0% 71.8% 28.2% 32.0% 68.0% 37.0% 63.0% 21.3% 78.7% 21.5% 78.5% 24.9% 75.1% 71.3% 28.7% 57.9% 42.1% It seems unreasonable that PacifiCorp would add almost 800 MW of FOT capacity to the Westside of the System all in one year (between 2011 and 2012), particularly in a time frame during which many sources indicate that market availability may not materialize. This strategy carries significant risk absent demonstration with more certainty that a sufficient amount of FOTs will be available at a reasonable cost. OCS Comments, PacifiCorp 2008 IRP June 18, 2009 Attachment 2, page 10 On page 130-133 the Company provides a relatively brief explanation of various FOT options by hub, product type, capacity (MWs) and availability. As inferred by the discussion on page 222, these options have been expanded to account for the Front Office’s recent reassessment of transmission availability to move power from markets to loads and near-term market liquidity and depth. However, the Company provides no evidence in the IRP that the Front Office’s updated analysis of near-term market opportunities has been corroborated by any credible external source.8 One credible external source for assessing expected loads and resources in western markets is the Western Electricity Coordinating Council (WECC). WECC’s most recent Power Supply Assessment (PSA) was released in November 2008 and conveys that the Basin, Rockies and DSW sub-regions are all resource deficit by 2011 in the summer period; a deficit that rapidly increases by 2012-2013, which is precisely the time when PacifiCorp plans to sharply increase its reliance on FOTs at various market hubs. However, the data underlying the 2008 PSA is stale, especially given the severity of the economic recession and the resulting impacts on regional loads. The next PSA isn’t expected to be released until late 2009, which is obviously too late to rely on for this IRP. The Office is very concerned about the riskiness of a resource planning strategy that relies so heavily on short-term market purchases to fill a rapidly increasing resource deficit position. While the Company’s 5b CCCT Wet preferred portfolio has the lowest risk adjusted PVRR (averaged across the $0, $45 and $100 carbon tax simulations) and rate impact, the 5b CCCT Wet Case also has the highest upper tail risk and production cost standard deviation among the B series cases examined.9 Furthermore, Table 8.20 on page 213 of the IRP shows that the original resource portfolios with greater reliance on FOTs have higher amounts of ENS. These data appear to confirm the riskiness of the plan, rather than justify the levels of FOT as being reasonable. Capacity Contributions of Front Office Transactions Chapter 6 page 134 states For example, a 100 MW front office transaction is treated as a 112 MW contribution to meeting PacifiCorp’s load obligation plus a 12 percent planning reserve margin, with the selling counterparty holding the reserves necessary to make the product firm. 8 For example, in response to CCS DR 3.5(b), PacifiCorp states that it uses several outside sources (PIRA, CERA, Wood MacKenzie), to assist the Company in evaluating the western interconnect. 9 IRP, pg. 238. OCS Comments, PacifiCorp 2008 IRP June 18, 2009 Attachment 2, page 11 PacifiCorp’s logic is that in the case of a firm transaction, the neighboring system is obligated to supply reserves, therefore, PacifiCorp doesn’t have to. Therefore, PacifiCorp assumes that a firm purchase of 100 MW supplied by a neighboring utility is equivalent to a 112 MW generating unit that PacifiCorp constructs. While it is reasonable to consider the amount of firm capacity in the calculation of reserve margin, it is inappropriate to increase the capacity an additional 12% in the calculation absent a demonstration that this is accepted industry practice (in particular by the counterparties to these transactions) and consistent with WECC requirements. Therefore, it appears that not only does PacifiCorp rely too heavily on Front Office Transactions in its resource plan, but it also gives too much load carrying credit to them when it determines how much capacity must be added in each year. Capacity Factors of Natural Gas Plants Table 8.3 (IRP, pg.189) shows the average capacity factors (CFs) for PacifiCorp’s existing gas and coal plant fleets over different time periods. The table shows how the average CFs for the respective gas and coal plant fleets are impacted by different combinations of gas price and carbon tax scenarios beginning in 2013 and thereafter. However, the table also reports the average CFs for the gas and coal plant fleets for the 2009-2013 period; a time period prior to the when the carbon tax takes effect. A comparison of the average CFs for its gas fleet in the top performing portfolios (Original Cases 2, 5, 8 and 9) indicates that the CFs for three of the cases (Cases 5, 8 and 9) are between 30%-35%. In the 2014-2019 period the average capacity factors do not exceed 42% under any scenario. These appear to be very low CFs for a gas fleet that predominately includes CCCT plants such as Hermiston, Currant Creek, Lakeside 1 and Chehalis. CCCT plants typically operate as intermediate or baseload facilities with much higher CFs. The Company should provide a detailed explanation of the major resource planning and plant dispatch assumptions that result in its CCCT plants being operated at relatively low annual CFs. These results have implications beyond simple operational decisions examining the spread between natural gas fuel input prices and electric market prices. Depending on what drives the low capacity factors, hard fixing the decision for additional natural-gas fired plants during this time period may be further called into question. Typically, capacity factors in the 30 – 40% range are not high enough for natural gas plants to be considered cost beneficial choices. Additional information must be provided in order for the Company's decision to be sufficiently analyzed. OCS Comments, PacifiCorp 2008 IRP June 18, 2009 Attachment 2, page 12 Conclusions The preferred portfolio presented by the Company in this IRP cannot be found to be optimal or reasonably likely to provide capacity additions at least cost considering risk for the reasons presented in this analysis. Thus, the IRP is not consistent with the definition of integrated resource planning provided by the Commission in Standards and Guidelines for Integrated Resource Planning for PacifiCorp’s Utah Jurisdiction and cannot be acknowledged by the Commission.

