Vietnam's Underground Economy
advertisement
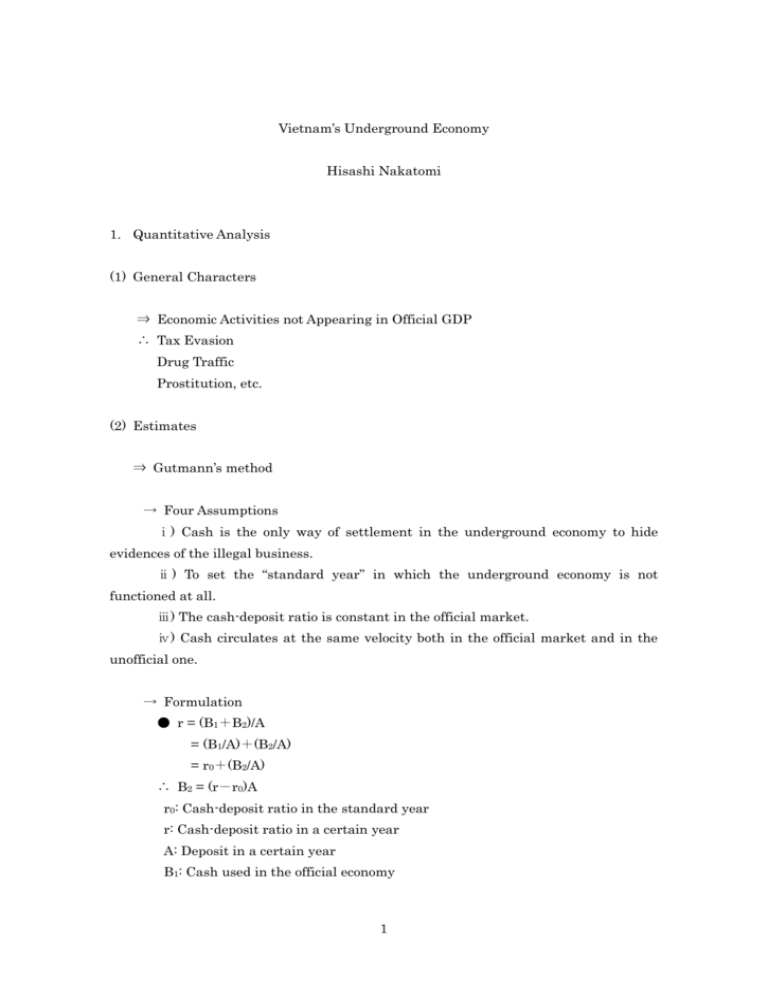
Vietnam’s Underground Economy Hisashi Nakatomi 1. Quantitative Analysis (1) General Characters ⇒ Economic Activities not Appearing in Official GDP ∴ Tax Evasion Drug Traffic Prostitution, etc. (2) Estimates ⇒ Gutmann’s method → Four Assumptions ⅰ) Cash is the only way of settlement in the underground economy to hide evidences of the illegal business. ⅱ ) To set the “standard year” in which the underground economy is not functioned at all. ⅲ) The cash-deposit ratio is constant in the official market. ⅳ) Cash circulates at the same velocity both in the official market and in the unofficial one. → Formulation ● r = (B1+B2)/A = (B1/A)+(B2/A) = r0+(B2/A) ∴ B2 = (r-r0)A r0: Cash-deposit ratio in the standard year r: Cash-deposit ratio in a certain year A: Deposit in a certain year B1: Cash used in the official economy 1 B2: Cash used in the underground economy ● v1 = Y1/D1 = Y1/(A+B1) ● v2 = Y2/D2 = B2 ● v1 = v2 ∴ Y2 = B2Y1/(A+B1) = B2v1 ∴ GDP in the underground economy is the product between the quantity of cash in the underground economy and the velocity of circulation in the official economy. Y1: GDP in the official economy Y2: GDP in the underground economy D1: Money in the official economy D2: Money in the underground economy v1: Velocity of circulation in the official economy v2: Velocity of circulation in the underground economy Table 1:Scale of the Underground Economy(1986-1999) Year Underground GDP Ratio 1 Ratio 2 (billion dong) (%) (%) 86 87 43.9 14.5 87 329 36.9 11.5 88 1,505 32.8 9.8 89 2,012 20.5 7.2 90 4,146 25.6 9.9 91 6,686 24.4 8.7 92 13,643 31.8 12.3 93 21,156 37.6 15.5 94 27,638 39.0 16.2 95 29,282 29.0 13.1 96 30,680 26.5 11.9 97 30,148 22.8 10.2 98 29,758 19.8 8.2 99 35,290 22.0 8.9 Re:Ratio 1 = Underground GDP/Service Sector’s GDP. Re:Ratio 2 = Underground GDP/Total GDP. 2 → Application to the Vietnamese Economy * Assumptions: ⅰ) The standard year is 1989. ⅱ) The underground economy exists only in the “service” market. * Results: ∴ The highest is 39.0%, the lowest is 19.8%, and the average is 27.9%. ∴ In the “service” market, scale of the underground economy is about 30% of the official economy. ∴ Scale of the underground economy is about 10% of the whole official economy. ⇒ Tangi’s method → Two Assumptions * Tax evasion causes the underground economy. * Tax increase causes demand increase for cash in the underground economy. → Original Formulation ● C/M2 = F(T/Y, W/Yp, y, i) C/M2: Cash/M2 T/Y: Income Tax/Total Income W/Yp: Wage & Salary/Private Business Income y: Real Income per capita i: Interest Rate of Fixed Time Deposit → Relationship between Variables ● Tax↑*** T/Y↓ *** C/M2↑ ● Private Business Income↑*** W/Yp↓ *** C/M2↓ ● y↑*** C/M2↓ ● i↑*** C/M2↓ → Formulation in the case of the Vietnamese Economy (1992 - 2000) ● ln(C/M2) = α + βlnT + γlnY + δlnD + εlnL + lnU C/M2: Cash/M2 T: Personal Income Tax 3 Y: Real GDP per capita D: Nominal Interest Rate of 3 months Time Deposit L: Potential Unemployed / Labor Forces U: Disturbance Term → Expected Relationship between Variables ● T↑*** C/M2↑*** β>0 ● Y↑*** C/M2↓*** γ<0 ● D↑*** C/M2↓*** δ<0 ● L↑*** C/M2↑*** ε>0 → Estimated Formulation ● ln(C/M2) = 19.03 -0.09lnT -3.86lnY -0.16lnD + 0.33lnL (4.23) (-1.26) (-5.82) (-2.03) (0.48) ● R = 0.98, DW = 2.21 * Results: β<0, γ<0, δ<0, ε>0 ∴ β is negative contrary to my expectation. ∴ T↑*** C/M2↓ ∴ Tax increase does not increase activities in the underground economy!? ∵ Few Vietnamese people pay this tax. ∴ ε is positive. ∴ L↑*** C/M2↑ ∴ Only L increases activities in the underground economy!? → Amended Formulation ● If unemployment exist, the underground economy exists, too. ● Gutmann’s assumptions ⅲ & ⅳ are applicable to this model. * Results: ∴ Scale of the underground economy is about 10% of the whole official economy. ⇒ How about these results? ∴ I think this figure is too small. Why? 4 Table 2:Estimate of the Underground Economy Year Official GDP Velocity of Underground Underground GDP/Official circulation GDP GDP (trillion dong) (%) (trillion dong) 1992 110.5 7.95 11.1 10.1 1993 140.3 8.02 13.6 9.7 1994 178.5 8.54 18.8 10.5 1995 228.9 10.55 27.4 12.0 1996 272.0 11.06 35.4 13.0 1997 313.6 11.12 44.5 14.2 1998 361.0 11.61 58.1 16.1 1999 399.9 7.89 63.9 16.0 2000 441.1 5.48 61.9 14.0 2. Qualitative Analysis ⇒ Does Vietnam’s underground economy have special characters? Yes. What? How about the historical overview? (1) Period of the Planning Economy? ⇒ Faults of “Bao Cap” System → If the market completely functions, a certain goods has the only one price. ∴ The Law of One Price → If the market incompletely functions, a certain goods has plural. → For example, rice has 4 prices in Vietnam. → Why? ∵ Rice deals in 4 markets under “Bao Cap” system: 5 ⅰ) Ration Market ⅱ) Public Free Market ⅲ) Private Free Market ⅳ) Black Market → Underground Economy ∴ a1<a2<a3<a4 a1: price in (ⅰ), a2: price in (ⅱ), a3: price in (ⅲ),a4: price in (ⅳ) → Supply Side *** How do farmers distribute rice? ⅰ) They consume by themselves. → Ration Market ⅱ) They pay agricultural tax. → Ration Market ⅲ) The government Compulsorily purchases by the public free market price. → Public Free Market ⅳ) They sell to the Private Free Market. → Private Free Market ⅴ) They sell to the Black Market. → Black Market ⇒ Incredibility of the Vietnamese “Dong” → An example *** 1kg of rice (= same quality): D10 in the ration market; D100 in the public free market *** ∴ The Vietnamese “Dong” is inadequate as “numeraire”. → What do people credit instead? ∴ US dollar, gold, cigarettes, rice, etc. → Where do they use US dollar, gold, cigarettes, rice, etc? ∴ They use them in the black market. ⇒ Does the underground economy exist in each market? ⅰ) Goods Market → Yes ∵ D(=Demand)>S(=Supply) in the official market ∵ Consumers face absolute shortage of goods in the official market ∵ Producers do not unload their products freely in the official market 6 ⅱ) Service Market → No, in principle ∵ There is no concept of “service” in the planning economy. ⅲ) Labor Market → No ∵ Suppliers in the labor market = Demanders in the goods market ∵ Demanders in the labor market = Suppliers in the goods market ∵ D(=Demand)>S(=Supply) in the official market ⅳ) Capital (= Financial) Market → No, in principle ∵ The role of banking system concentrates on “accounting” in the planning economy. ⇒ How about scale of the underground economy in the planning economy? → more than, or less than 10% of the official GDP? ∴ I think it is larger. (2) Period of the Market Economy? ⇒ Collapse of “Bao Cap” System → Imbalance between the supply side and the demand side in the official market ∴ D>S ∴ Chronic shortage of goods → Faults of the supply side ∴ The government cannot supply sufficient capital goods for the producers. ∴ The actual production falls down its planning. ∴ The government cannot supply sufficient goods for the consumers in the ration market. → Reform of “Bao Cap” System *** The government raises the price of goods in the ration market. 7 *** The living standard of the beneficiaries becomes worse. *** The government raises the salary of the beneficiaries. *** The government faces serious financial difficulty. ∴ Wage-price spiral → Abolition of the ration system in 1985 ∴ Outbreak of hyper-inflation ∵ The prices in the official market rise towards the prices in the black market. ∴ This is the Vietnamese “big bang”. ∴ As a result, abolition of the ration system becomes the “shock therapy”. ∴ The law of one price begins to function. ⇒ Results of “Big bang” → Changing situation in markets ⅰ) Goods Market *** Shortage of goods is settled in the official market. *** The black market loses its raison d’être. ∴ The black market disappears. ∴ The underground economy does not exist in the goods market. ⅱ) Service Market *** The underground economy does not exist in the period of the planning economy. ∵ “Service” is not counted in GDP. *** The underground economy newly exists in the period of the market economy. ∵ “Service” is counted in GDP. *** How about its scale? ∴ It is big. ∵ The government still monopolize many sectors. ∴ Spread of “tham nhung” ( = corruption). ⅲ) Labor Market *** In principle, the situation in the period of the market economy is as same as in the period of the planning economy. ∴ The underground economy does not exist in the period of the market economy. ⅳ) Capital Market 8 *** The capital market newly makes up in the period of the market economy. *** The underground economy newly exists in the period of the market economy. *** Why? ∵ People prefer the traditional financial facilities to the official one. ∵ People prefer Us dollar, gold, etc to the Vietnamese “Dong”. *** How about its scale? ∴ It is smaller than in the service market. ∵ Preference of US dollar, gold, etc ↓ ∵ Preference of the Vietnamese “Dong” ↑ 3. Conclusion (1) About my Model: its Faults → Few samples *** Model 1: 1986-1999 *** Model 2: 1992-2000 ∴ There is no sample in the period of the planning economy. ∴ My models cannot estimate scale of the underground economy in the period of the planning economy. → There is neither US dollar nor gold in my explanatory variables. *** People use not only the Vietnamese “Dong” but also US dollar and gold in the underground economy. (2) About my Estimate → My models may underestimate scale of the underground economy. ∵ My models do not consider the role of US dollar or gold. → But scale of the underground economy may reduce. ∵ My models do not consider the role of US dollar or gold ∵ Preference of US dollar, gold, etc ↓ ∵ Preference of the Vietnamese “Dong” ↑ (End) 9
