MKTG 4250, Product Strategy Professor Jay Waddell Sandwich
advertisement
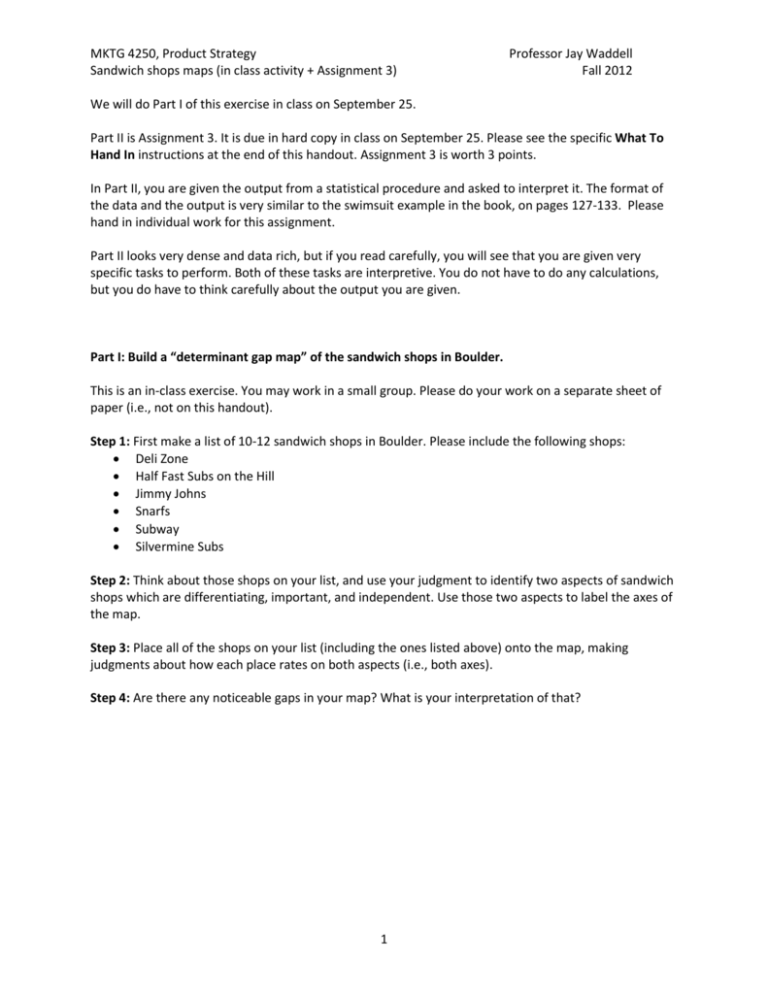
MKTG 4250, Product Strategy Sandwich shops maps (in class activity + Assignment 3) Professor Jay Waddell Fall 2012 We will do Part I of this exercise in class on September 25. Part II is Assignment 3. It is due in hard copy in class on September 25. Please see the specific What To Hand In instructions at the end of this handout. Assignment 3 is worth 3 points. In Part II, you are given the output from a statistical procedure and asked to interpret it. The format of the data and the output is very similar to the swimsuit example in the book, on pages 127-133. Please hand in individual work for this assignment. Part II looks very dense and data rich, but if you read carefully, you will see that you are given very specific tasks to perform. Both of these tasks are interpretive. You do not have to do any calculations, but you do have to think carefully about the output you are given. Part I: Build a “determinant gap map” of the sandwich shops in Boulder. This is an in-class exercise. You may work in a small group. Please do your work on a separate sheet of paper (i.e., not on this handout). Step 1: First make a list of 10-12 sandwich shops in Boulder. Please include the following shops: Deli Zone Half Fast Subs on the Hill Jimmy Johns Snarfs Subway Silvermine Subs Step 2: Think about those shops on your list, and use your judgment to identify two aspects of sandwich shops which are differentiating, important, and independent. Use those two aspects to label the axes of the map. Step 3: Place all of the shops on your list (including the ones listed above) onto the map, making judgments about how each place rates on both aspects (i.e., both axes). Step 4: Are there any noticeable gaps in your map? What is your interpretation of that? 1 MKTG 4250, Product Strategy Sandwich shops maps (in class activity + Assignment 3) Professor Jay Waddell Fall 2012 Part II: Build a perceptual gap map based on attribute ratings from a survey In this part, you will build a perceptual map of the sandwich shops in Boulder, using the data and the resultant analysis from a survey about attributes of sandwich shops. You do not need to do any statistical analysis—you are given all the output you need. Your assignment is to understand the data that was collected and interpret the output of the analysis. There are two tasks in this part. Task #1 is to name the factors. Task #2 is to build a map. Be sure to do both of them. Step 1: Read the survey that was used to collect data. The following questions were asked about each of the six sandwich shops listed in Part I. Please indicate how much you agree or disagree with each of the following statements. 1 = Strongly disagree 2 = Disagree 3 = Neutral 4 = Agree 5 = Strongly agree 1. 2. 3. 4. 5. 6. 7. 8. 9. 10. 11. 12. 13. 14. 15. This place has filling sandwiches. This place is clean. This place has good variety. This place has healthy choices. This place has tasty food. This place has good value. This place has low prices. This place has good hours of operation. This place has fresh ingredients. This place has good delivery options. This place has a convenient location. This place has good service. This place has coupons available. This place has greasy food. This place has good atmosphere. 1 … 2 … 3 …. 4 …. 5 1 … 2 … 3 …. 4 …. 5 1 … 2 … 3 …. 4 …. 5 1 … 2 … 3 …. 4 …. 5 1 … 2 … 3 …. 4 …. 5 1 … 2 … 3 …. 4 …. 5 1 … 2 … 3 …. 4 …. 5 1 … 2 … 3 …. 4 …. 5 1 … 2 … 3 …. 4 …. 5 1 … 2 … 3 …. 4 …. 5 1 … 2 … 3 …. 4 …. 5 1 … 2 … 3 …. 4 …. 5 1 … 2 … 3 …. 4 …. 5 1 … 2 … 3 …. 4 …. 5 1 … 2 … 3 …. 4 …. 5 Step 2: Examine the average scores on each question for each shop. The average scores for each shop for each question are shown in the chart and table below: Table 1: Average rating (on a 1-5 scale) on each attribute for each shop: 5.00 4.50 4.00 3.50 3.00 2.50 2.00 1.50 1.00 0.50 0.00 Filling Clean Variety Healthy Choices Tasty Good Value Low Prices Hours Fresh Delizone 4.32 3.53 4.21 3.63 4.32 3.42 2.89 3.63 3.84 3.00 4.11 3.74 3.11 3.32 3.84 Half Fast 4.56 3.56 4.58 3.56 4.36 3.72 2.47 4.08 3.83 3.22 3.89 3.61 3.28 3.03 4.33 Jimmy Johns 3.42 3.79 3.29 3.71 3.88 3.38 3.08 4.42 3.71 3.88 4.17 3.83 3.42 2.29 3.58 Snarfs 3.74 2.58 3.74 3.47 4.11 3.37 2.89 3.42 3.58 3.21 3.53 3.53 2.95 2.95 3.05 Silvermine 3.55 3.58 3.27 3.18 3.45 3.45 3.18 4.27 3.15 4.18 3.52 3.45 3.79 2.61 2.76 Subway 3.67 3.64 3.46 4.31 3.44 3.54 3.54 3.59 3.38 1.49 3.74 3.28 3.72 1.87 2.62 2 Delivery Location Service Coupons Greasy Atmosph ere MKTG 4250, Product Strategy Sandwich shops maps (in class activity + Assignment 3) Professor Jay Waddell Fall 2012 Step 3: Examine the output of the factor analysis and name the factors Similar to the analysis in Crawford and Di Benedetto’s Chapter 6 in the book (pp. 127-133), a “factor analysis” was performed on the data to see if there were common underlying themes to the fifteen attributes. For example, one might expect that the scores on the “good value” and “low prices” questions would be tightly linked (that is, highly correlated). We would expect these attributes to be related in a factor related to cost. Here is the first piece of output from the analysis that was done (I used SPSS and Excel). Similar to Figure 6.7 in the book, Table 2 shows the Factor Loading Matrix, that is, the correlation of the original set of attributes to their underlying factors. Table 2: Factor Loading Matrix (like Figure 6.7) Factor 1 Filling 0.8413 Clean 0.0849 Variety 0.8349 Healthy Choices 0.3238 Tasty 0.8395 Good Value 0.5544 Low Prices -0.1742 Hours 0.1695 Fresh 0.6543 Delivery 0.0460 Location 0.3172 Service 0.2955 Coupons -0.0257 Greasy 0.1871 Atmosphere 0.6961 Factor 2 0.0375 0.4884 0.0673 -0.1047 0.1970 0.2112 0.0346 0.7703 0.1272 0.7518 0.4069 0.4686 0.4708 0.0515 0.3499 Factor 3 -0.0575 0.5900 -0.0233 0.6899 0.0141 0.0926 0.1070 0.0289 0.3465 -0.3164 0.2095 0.0744 0.1551 -0.7285 -0.1053 Factor 4 0.0336 -0.1016 -0.0249 0.2988 0.0255 0.5886 0.8789 0.1214 0.0329 -0.1035 0.0513 0.2542 0.4350 -0.0961 -0.2961 Task #1: Name the factors. In this analysis, the output showed four factors, instead of only two factors as in the swimsuit example in the book (fashion and comfort). To name the factors, circle the “biggest” number in each row. (I put “biggest” in quotes because a high loading can be a high positive or negative correlation. So you really need to circle the number with the biggest absolute value in each row.) If the two biggest numbers are close, circle them both. For example, the first attribute, (filling sandwiches) is loaded most highly on Factor 1, so circle the .8413. And the second attribute (clean) is loaded most highly on Factor 3, so circle the .5900. Look at your pattern of circles. Try to give names to the groups of attributes that have circles on the same factor (= the same column). Fill in the names you come up with below. This is a challenging but realistic example. Factor 1 name: _______________________ Factor 2 name: _______________________ Factor 3 name: _______________________ Factor 4 name: _______________________ 3 MKTG 4250, Product Strategy Sandwich shops maps (in class activity + Assignment 3) Professor Jay Waddell Fall 2012 Step 4: Use the rest of the factor analysis output to build a map of the market Table 3 shows the Factor-Scores Coefficient Matrix, that is, the regression weights that relate the attribute scales to the factor scores. This output is similar to Figure 6.8 in the book. Table 3: Factor-Scores Coefficient Matrix (like Figure 6.8) Factor 1 Factor 2 Factor 3 Filling 0.2672 -0.1168 -0.0900 Clean -0.0825 0.2615 0.4182 Variety 0.2578 -0.0940 -0.0534 Healthy Choices 0.0887 -0.1340 0.3821 Tasty 0.2374 -0.0296 -0.0392 Good Value 0.1476 -0.0302 -0.0965 Low Prices -0.0546 -0.0373 -0.1140 Hours -0.0678 0.3767 -0.0136 Fresh 0.1720 -0.0373 0.1930 Delivery -0.0896 0.4066 -0.1903 Location 0.0269 0.1647 0.1149 Service 0.0200 0.1815 -0.0200 Coupons -0.0850 0.2167 0.0110 Greasy 0.0884 0.0046 -0.4800 Atmosphere 0.1689 0.1059 -0.0403 Factor 4 0.0451 -0.2496 -0.0074 0.0757 0.0081 0.3896 0.6015 0.0095 -0.0564 -0.0752 -0.0442 0.1253 0.2325 0.0907 -0.2129 To get the final factor scores (i.e., a score for each shop on each factor), I follow the procedure described in the bottom of Figure 6.8, multiplying the average attribute scores for each shop from Table 1 by the corresponding factor-score coefficient from Table 3, and adding up all the products. Table 4: The final results of the analysis Delizone Half Fast Jimmy Johns Snarfs Silvermine Subway Factor 1 4.649 4.861 3.724 4.157 3.349 3.761 Factor 2 4.090 4.341 5.068 3.747 4.985 3.415 Factor 3 0.226 0.233 0.804 -0.083 0.155 1.497 Factor 4 2.750 2.500 2.741 3.024 3.127 3.546 Task #2: Construct a map Build a map using the results in Table 4. Unlike the Dell Computers case or the swimsuit example, you will not be able to fit all four factors on one map. (Those other examples only had two factors which fit nicely on a two-dimensional map. But here, there is no way to draw a four-dimensional map.) Select two of the four factors and draw a map using them. Be sure to label the axes with the factor names you came up with in Task 1. What conclusions do you draw from your map? 4 MKTG 4250, Product Strategy Sandwich shops maps (in class activity + Assignment 3) Professor Jay Waddell Fall 2012 What to Hand In for Assignment 3 A single, separate sheet of paper (this page is fine) containing The results of Part II, Task #1: the names you assigned to each of the four factors, and The results of Part II, Task #2: a) a map drawn using two of the four factors, and b) a paragraph or bullet points with your conclusions from the map. Your name: Section time: 5
