chap1b
advertisement

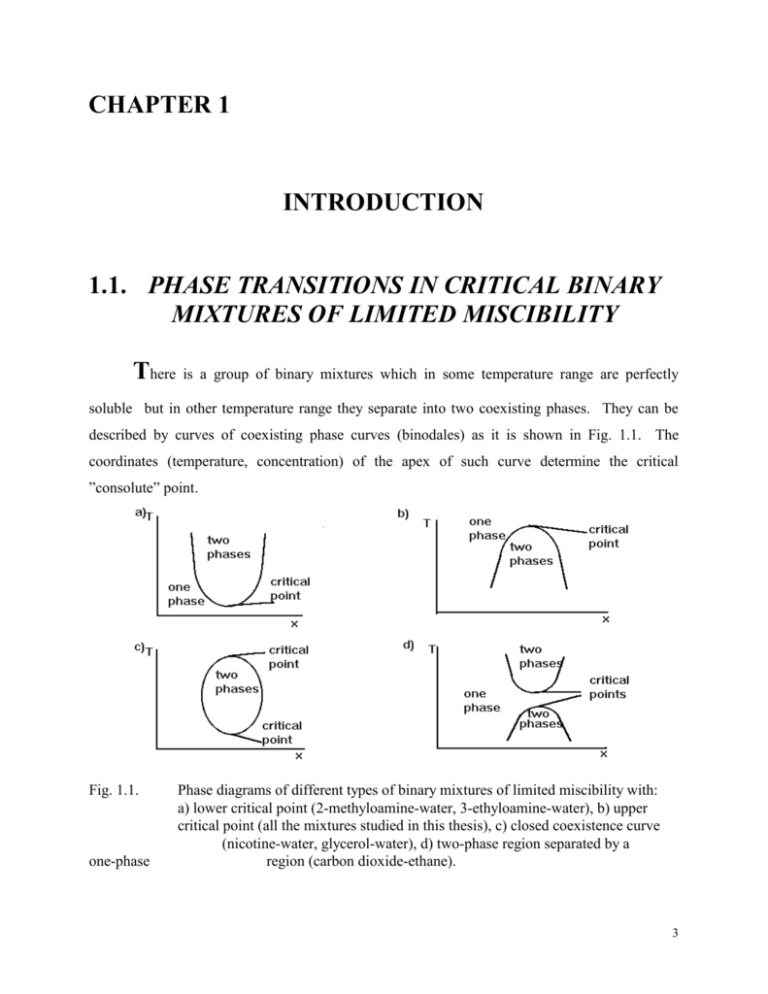
CHAPTER 1 INTRODUCTION 1.1. PHASE TRANSITIONS IN CRITICAL BINARY MIXTURES OF LIMITED MISCIBILITY There is a group of binary mixtures which in some temperature range are perfectly soluble but in other temperature range they separate into two coexisting phases. They can be described by curves of coexisting phase curves (binodales) as it is shown in Fig. 1.1. The coordinates (temperature, concentration) of the apex of such curve determine the critical ”consolute” point. Fig. 1.1. one-phase Phase diagrams of different types of binary mixtures of limited miscibility with: a) lower critical point (2-methyloamine-water, 3-ethyloamine-water), b) upper critical point (all the mixtures studied in this thesis), c) closed coexistence curve (nicotine-water, glycerol-water), d) two-phase region separated by a region (carbon dioxide-ethane). 3 In the most simple case, when a mixture has the upper critical point, the mixture is always homogeneous above the critical temperature. Concentration may be defined in several different ways: as a mole fraction, volume fraction or weight fraction. The change from one concentration definition to another is not a linear function. This causes changes in the form of equation describing the coexistence curve [27,28]. The coordinates of the apex of the coexistence curve, the critical point, are dependent on the molecular properties of the given system. This effect is most easily followed when testing a number of binary solutions of limited miscibility in which one constituent is fixed and the second is formed by various liquids belonging to one homologues series [38]. Guggenheim in his book ”Thermodynamics” [20] showed, that a proper reduction of variables may lead to reduction of the coexisting curves of various substances to one universal curve. Such behaviour was a base for the law of corresponding states for liquids. Based on the one-component systems with the gas-liquid critical point Guggenheim stated that: L U B0 T TC ~ B0 T TC 13 (1.1) where: L, U are the densities of lower and upper phase respectively, B0 is an amplitude, TC is the critical temperature and is the critical exponent. Along with the law of the rectilinear diameter of the coexistence curve (binodale) formulated in the XIXth century by Cailletet and Matthias: L U C C1 T TC ... 2 (1.2) it is possible to give a complete description of the coexistence curve. The law of corresponding states made it possible to obtain the critical density (concentration) or the density of the fluid along the coexistence curve. Some doubts as for the law of the rectilinearity of the binodale increased particularly after 1970. Theoretical models [21-25] stated that: C D0 t 1 D1 t ... t = (T - TC)/TC (1.3) Similar relations can be formulated for mixtures of limited miscibility: X U X L BO T TC XU X L C C1 T TC 2 (1.4) (1.5) 4 X L X U C C1 T TC C2 T TC 1 . (1.6) where XU, XL are the concentrations of lower and upper phase respectively, B0, C, C1, C2 are the amplitudes and = 1 - 0.89 is the critical amplitude. However, in this case a question arises about the definition of the concentration X. For instance, it can be taken as molar, volume or mass fraction. For its introduction measurements of such properties as density or refractive index can also be applied. The most proper definition of X is still an unsolved problem [33]. Experiments which began right away didn’t, for a long time, give conclusive results. When comparing amplitudes D0 and D1 some difficulties in appearing and separation of the non-linear part arise, particularly when taking into account that 1 - 0.89 is almost equal one. Its separation would require data of high precision in the immediate vicinity of TC. First such result was published in 1976 for SF6 [26]. However, for one-component liquid-gas critical points and critical mixtures with the critical consolute point the experimental problems and the weakness of the diameter anomaly caused eq. (1.1) to be widely criticised. Yet conducted experiments concerning the gas-liquid critical point in metallic Rubidium and Caesium, where the violation of the law of the rectilinearity of the binodale is impressive, definitely confirmed eq. (1.3). Now it is also clear that eq. (1.1) could be applied as a useful tool for determining the concentration (density, dielectric permittivity). An important feature of the critical phenomena is the concept of universality [29,31]. According to this, the variety of systems that show critical phenomena can be divided into equivalence classes called universality classes, such that the critical universal quantities of all the systems within a given universality class are identical. Two factors are thought to distinguish the various universality classes: (1) d, the spatial dimensionality of the system and (2) n, the number of components of the order parameter. Binary fluids belong to the (d = 3, n = 1) universality class, together with pure fluids (liquid + gas systems) and simple Ising magnets. Universal system independent quantities are for instance critical exponents and ratios of critical amplitudes and critical exponents. The above universal quantities are defined by a general formula: LC Ax 1 a i x i (1.7) 5 where LC is the critical part of a physical quantity L, x is the distance from the critical point, A, -are an critical amplitude and critical exponent respectively, ai , i are the critical amplitude and critical exponent of correction to scaling term, respectively. Theoretical and experimental values of critical exponents for (3, 1) and (3,3) universality classes (for comparison) are given below: Physical quantity Critical Exponent Mean field approximation 3-dim. Ising model 3-dim. Heisenberg model * Specific heat 0 - 0.1 0.11 0.005 - CV ~ t Order parameter 0.5 0.35 0.325 0.002 L -U ~ (-t) Response function 1 1.4 1.241 0.002 KT ~ t- General force as a order 3 5 parameter function 0.7 Correlation radius ~ t- 0.630.002 Correlation function 0.03 0.0310.004 First correction to scaling 0 1 0.4980.02 Tab. 1.1. Critical exponents for (3,1) universality class and for (3,3) universality class (*). Physical quantity Critical Exponents Specific heat 0.119 0.008 Order parameter 0.328 0.004 Response function 1.24 0.05 General force as a order 4.8 0.2 parameter function Correlation radius 0.625 0.006 Correlation function 0.017 0.02 First correction to scaling 1 0.5 0.03 Tab. 1.2. Critical exponents obtained experimentally for (3,1) universality class [33-37] to which critical mixtures belong. Apart from universal quantities, binary mixtures are described by nonuniversal ones, as the critical temperature TC and the critical concentration XC. For the dipole compounds (nitrobenzene, 1-nitropropane), tested in this thesis, a systematic increase of both parameters with 6 the increase of the length of n-alkane molecule was noticed [40]. Both XC and TC depend on the value of the hydrostatic pressure acting on the mixture. As it was stated in ref. [40] dTC P dP VE TC E H (1.8) where VE is the excess volume and HE is the excess enthalpy. It is almost inconceivable that HE could be negative for any critical solutions with an upper critical point tested [37] hence the change in the sign of dTC/dP should be reflected in the sign of the volume excess only. For 1-nitropropane-dodecane solution the authors [40] obtained VE + 4 cm3 / mol in agreement with the positive sign of dTC/dP in 1-nitropropane-n-alkanes mixtures. The same correlation exists also for nitrobenzene-n-alkanes mixtures: for nitrobenzene-hexane mixture VE - 2.7 cm3 / mol (dTC/dP < 0) and for nitrobenzene-tetradecane mixture VE + 1.3 cm3 / mol (dTC/dP > 0). All the values were determined for T = TC + 5 K. 6 nitrobenzene-tetradecane nitrobenzene-dodecane nitrobenzene-decane nitrobenzene-octane nb-hexane 4 TC / K 2 0 -2 0,05 dTC / dP 0,00 -4 -0,05 -0,10 -6 -0,15 -0,20 -8 0 40 80 120 6 8 10 160 n 12 14 200 P / MPa Fig. 1.2. The dependence of critical temperature TC due to the action of pressure (T = TC(P) - TC(0.1 MPa)) for nitrobenzene-n-alkanes mixtures: () hexane (n = 6), () octane (n = 8), () decane (n = 10), (o) dodecane (n = 12), 7 () tetradecane (n = 14). The inset shows dTC/dP as a function of number of carbon atoms in the n-alkane molecule (n). 14 1-nitropropane-octane 1-nitropropane-decane 1-nitropropane-dodecane 1-nitropropane-tetradecane 1-nitropropane-hexadecane 12 TC / K 10 8 0,16 6 0,14 0,12 dTc / dP 4 0,10 0,08 2 0,06 0,04 8 0 0 20 40 60 80 10 12 n 14 100 16 120 P / MPa Fig. 1.3. The dependence of critical temperature TC due to the action of pressure (T = TC(P) - TC(0.1 MPa)) for 1-nitropropane-n-alkanes mixtures: () octane (n = 8), () decane (n = 10), () dodecane (n = 12), () tetradecane (n = 14), (o) hexadecane (n = 16). The inset shows dTC/dP as a function of number of carbon atoms in the n-alkane molecule (n). The non dipole components are the aliphatic hydrocarbons with various carbon chain lengths (from hexane to hexadecane). The obtained dependencies of the phase separation temperature as a function pressure are presented (Figs. 1.2. - 1.4). In the case of mixtures of nitrobenzene with saturated hydrocarbons a marked dependence of dTC/dP on the length of the solvent molecule was observed (Fig. 1.2). Nitrobenzene-hexane mixture has the lowest and negative value of dTC/dP. With the increase in the length of the aliphatic hydrocarbon chain, the value of dTC/dP increases changing its sign to the positive one. Completely different properties are exhibited by 1-nitropropane critical solutions with the same aliphatic hydrocarbons (Fig. 1.3). In this case the sign and value of dTC/dP are independent of the solvent molecule length. 8 3 o-nitrotoluene-hexane o-nitrotoluene-decane o-nitrotoluene-tetradecane 1 0.05 0 0.00 dTc / dP TC / K 2 -1 -0.05 -0.10 -2 -3 -0.15 0 20 6 8 10 40 n 60 12 14 80 P / MPa Fig. 1.4. The dependence of critical temperature TC due to the action of pressure (T = TC(P) - TC(0.1 MPa)) for o-nitrotoluene-n-alkanes mixtures: () hexane (n = 6), () decane (n = 10), () tetradecane (n = 14). The inset shows dTC/dP as a function of number of carbon atoms in the n-alkane molecule (n). The values of dTC/dP increase with the increase of the length of the n-alkanes component: n-alkane nitrobenzene hexane octane decane dodecane tetradecane 1-nitropropane decane dodecane tridecane tetradecane hexadecane dTC/dP (K/MPa) - 0.165 0.01 - 0.039 0.004 - 0.023 0.004 0.007 0.002 0.018 0.003 0.11 0.03 0.11 0.02 0.11 0.01 0.11 0.01 0.12 0.01 9 2-nitrotoluene hexane - 0.10 0.03 decane - 0.003 0.01 tetradecane 0.052 0.002 Tab. 1.3. Values of dTC/dP for nitrobenzene - , 1-nitropropane - , o-nitrotoluene - n-alkanes binary mixtures. With the appearance of anti-parallel ordering of the nearest dipoles the sign and value of dTC/dP become dependent on the type of n-alkane used. For 1-nitropropane solutions virtually no dependence between the type of n-alkane and dTC/dP may be associated with the absence of short range ordering in this substance. The second parameter influenced by pressure is the critical concentration. Jacobs [41] empirically stated that: X C f TCatm. TC P (1.9) TC P where XC is the critical concentration, f is the coefficient, TCatm. is the critical temperature under atmospheric pressure and TC(P) is the critical temperature under elevated pressure of 10 MPa. Nevertheless, the experimental equation was formulated basing only on the low pressure data. Recent tests in nitrobenzene-dodecane binary mixture [42] conducted not only under atmospheric pressure but at a pressure up to 102 MPa gave XC 0.02 while eq. (1.9) gave XC 0.1. 1.2. EXPERIMENTAL DETERMINATION OF THE COEXISTENCE CURVES There are few methods of obtaining the shape of a coexistence curve. The first one is the visual method [27,38,43] in which the temperature TC at which menisci appear is determined. From up to twenty to some tens of solutions of various concentrations are placed in flame-sealed glass ampoules and set in a transparent thermostat to enable observation. For non-critical solutions, on decreasing the temperature, the new phase (meniscus) forms from the upper part (X > XC) or from the lower part (X < XC) of the ampoule. Initially (T TC) the volume of this new phase is infinitesimally small and the total concentration of the mixture corresponds to the 10 concentration of one of the coexisting phases. The volume of the new phase rises with lowering the temperature - the meniscus shifts. In a critical mixture the meniscus appears in the middle of the ampoule. In this case the ratio of volumes of the coexisting phases does not change with temperature. The advantageous feature of this method is that it permits direct, experimental, determination of XC and TC. The disadvantage of this method is feasibility of different influence of any admixtures on the mixtures in the various ampoules. In addition, for a given temperature only the composition of one of the phases is determined. In the second method temperature measurements are made in the critical mixture in the coexisting phases of the physical quantity which permits a straightforward determination of the state of the phases. Most frequency measurements were made of density [44], refraction coefficient [45], dielectric permittivity [9], electric resistance [46], NMR-frequency shift [47]. For this method it is necessary to know the value of XC. Moreover, in certain cases these measurements are intrusive (for instance electrical resistance measurements). In the immediate vicinity of TC they can be influenced by the gravitational effect [48]. The important advantage of this method is that the experiment can be made on one sample. The third possibility is to examine the miscibility of liquids making use of the visual methods in which measurements are made of volume of phases coexisting at the given temperature. For binary solutions, observation of two samples of different total concentration is sufficient. Calculations are then made based on the assumption: VCT VCU VCL (1.10) where VCT is the total volume of the one of the solution constituents, VCU, VCL are the volumes occupied by this constituent in the upper and lower phase, respectively. Using eq. (1.10) and applying the definition concentration in volume fraction leads to the system of equations: 1V1T LV1L U V1U T L L U U 2V2 V2 V2 t = const. (1.11) where: indices j = 1, 2 describe two samples of different total concentration j , indices ”U, L” are for the upper and lower phase, respectively. VjT, VjL, VjU are the total volume of given sample and volumes of coexisting phases, respectively. 11 If the tested mixtures are in glass tubes of constant diameter, then relation (1.11) may be written in a form: 1 h1 L 1 h1 U L U 2 h2 1 h2 (1.12) where: hj = VjL / VjT - fraction meniscus height. The solution of system of equations (1.11) and (1.12) determines the composition of coexisting phases in volume fraction for given temperature. 12


