Finding the “Critical Value”
advertisement
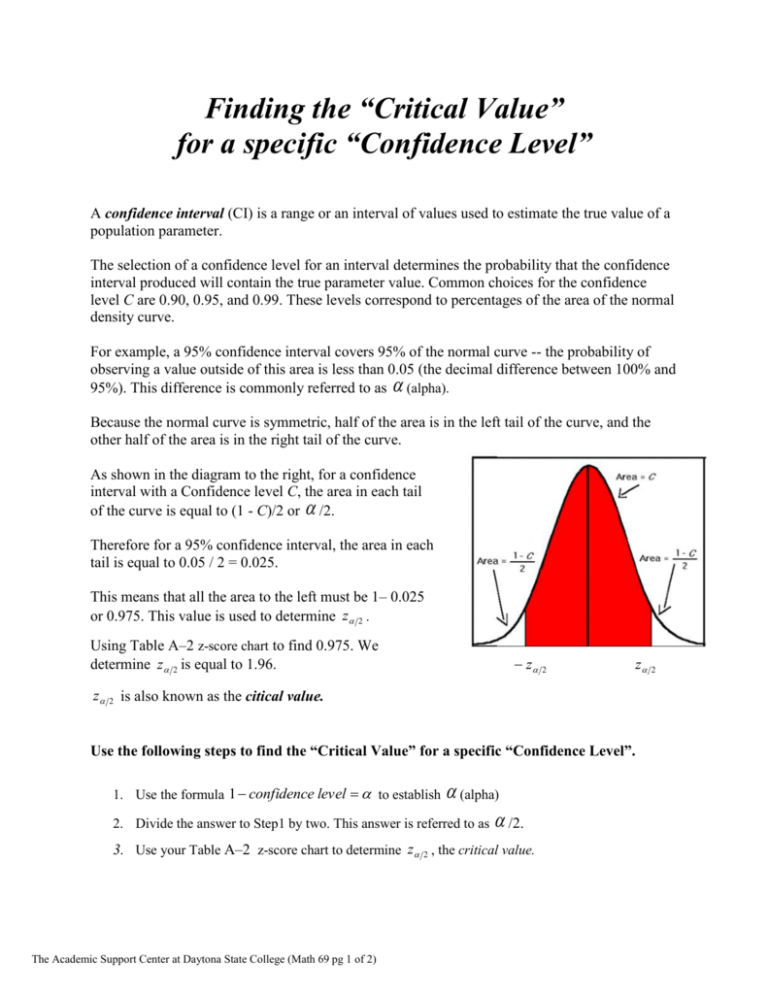
Finding the “Critical Value” for a specific “Confidence Level” A confidence interval (CI) is a range or an interval of values used to estimate the true value of a population parameter. The selection of a confidence level for an interval determines the probability that the confidence interval produced will contain the true parameter value. Common choices for the confidence level C are 0.90, 0.95, and 0.99. These levels correspond to percentages of the area of the normal density curve. For example, a 95% confidence interval covers 95% of the normal curve -- the probability of observing a value outside of this area is less than 0.05 (the decimal difference between 100% and 95%). This difference is commonly referred to as (alpha). Because the normal curve is symmetric, half of the area is in the left tail of the curve, and the other half of the area is in the right tail of the curve. As shown in the diagram to the right, for a confidence interval with a Confidence level C, the area in each tail of the curve is equal to (1 - C)/2 or /2. Therefore for a 95% confidence interval, the area in each tail is equal to 0.05 / 2 = 0.025. This means that all the area to the left must be 1– 0.025 or 0.975. This value is used to determine z 2 . Using Table A–2 z-score chart to find 0.975. We determine z 2 is equal to 1.96. z 2 z z 2 is also known as the citical value. Use the following steps to find the “Critical Value” for a specific “Confidence Level”. (alpha) Divide the answer to Step1 by two. This answer is referred to as /2. 1. Use the formula 1 confidence level to establish 2. 3. Use your Table A–2 z-score chart to determine z 2 , the critical value. The Academic Support Center at Daytona State College (Math 69 pg 1 of 2) 2 Finding the “Critical Value” for a specific “Confidence Level”(continued) Example: Find the “Critical Value” for a “Confidence Level of 90%”. 1. 1 confidence level 1 .90 .10 2. .10 .05 2 2 4. 1 .05 .95 5. After looking up .95 on the Z-score chart, Z was determined to be 1.645 Therefore the critical value of a 90% Confidence Level is 1.645 The table below was developed using the procedure outlined above. 0.90 Critical Value (Z-score) 1.645 0.91 1.70 0.92 1.75 0.93 1.81 0.94 1.88 0.95 1.96 0.96 2.05 0.97 2.17 0.98 2.33 0.99 2.575 Confidence Level The Academic Support Center at Daytona State College (Math 69 pg 2 of 2)


