financial ratios
advertisement

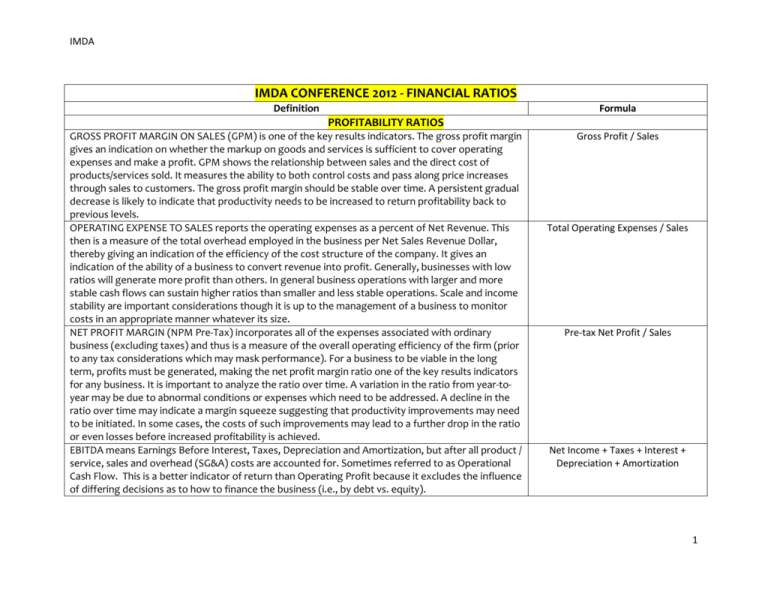
IMDA IMDA CONFERENCE 2012 - FINANCIAL RATIOS Formula Definition PROFITABILITY RATIOS GROSS PROFIT MARGIN ON SALES (GPM) is one of the key results indicators. The gross profit margin gives an indication on whether the markup on goods and services is sufficient to cover operating expenses and make a profit. GPM shows the relationship between sales and the direct cost of products/services sold. It measures the ability to both control costs and pass along price increases through sales to customers. The gross profit margin should be stable over time. A persistent gradual decrease is likely to indicate that productivity needs to be increased to return profitability back to previous levels. OPERATING EXPENSE TO SALES reports the operating expenses as a percent of Net Revenue. This then is a measure of the total overhead employed in the business per Net Sales Revenue Dollar, thereby giving an indication of the efficiency of the cost structure of the company. It gives an indication of the ability of a business to convert revenue into profit. Generally, businesses with low ratios will generate more profit than others. In general business operations with larger and more stable cash flows can sustain higher ratios than smaller and less stable operations. Scale and income stability are important considerations though it is up to the management of a business to monitor costs in an appropriate manner whatever its size. NET PROFIT MARGIN (NPM Pre-Tax) incorporates all of the expenses associated with ordinary business (excluding taxes) and thus is a measure of the overall operating efficiency of the firm (prior to any tax considerations which may mask performance). For a business to be viable in the long term, profits must be generated, making the net profit margin ratio one of the key results indicators for any business. It is important to analyze the ratio over time. A variation in the ratio from year-toyear may be due to abnormal conditions or expenses which need to be addressed. A decline in the ratio over time may indicate a margin squeeze suggesting that productivity improvements may need to be initiated. In some cases, the costs of such improvements may lead to a further drop in the ratio or even losses before increased profitability is achieved. EBITDA means Earnings Before Interest, Taxes, Depreciation and Amortization, but after all product / service, sales and overhead (SG&A) costs are accounted for. Sometimes referred to as Operational Cash Flow. This is a better indicator of return than Operating Profit because it excludes the influence of differing decisions as to how to finance the business (i.e., by debt vs. equity). Gross Profit / Sales Total Operating Expenses / Sales Pre-tax Net Profit / Sales Net Income + Taxes + Interest + Depreciation + Amortization 1 IMDA IMDA CONFERENCE 2012 - FINANCIAL RATIOS Definition RETURN ON EQUITY (ROE) measures the overall efficiency of the firm in managing its total investments in assets and in generating a return to stockholders. It is the primary measure of how well management is running the company. ROE allows you to quickly gauge whether a company is a value creator or a cash consumer. By relating the earnings generated to the shareholders equity, you can see how much cash is created from the existing assets. Clearly, all things being equal, the higher a company’s ROE, the better the company. ASSET MANAGEMENT RATIOS INVENTORY TURNS (Period Average) measures the average efficiency of the firm in managing and selling inventories during the last period, i.e., how many inventory turns the company has per period and whether that is getting better or worse. It is imperative to compare a company's inventory turns to the industry average. A company turning their inventory much slower than the industry average might be an indication that there is excessive and/or old inventory on hand which would tie up cash. The faster the inventory turns, the more efficiently the company manages its assets (as a stocking distributor, this will be influenced by the requirements of manufacturers to carry a “sufficient” amount of product in inventory). However, if the company is in financial trouble, on the verge of bankruptcy, a sudden increase in inventory turns might indicate it is not able to get product from their suppliers, i.e., the company is not carrying the correct level of inventory and may not have the product on hand to make sales. In looking at a quarterly statement, there probably are more or less turns than an annual statement due to seasonality; i.e., inventory levels will be higher just before the busy season than just after the busy season. This does not mean the business is managing its inventory any differently; the ratio is just skewed because of seasonality. NOTE: Comparing the two INVENTORY TURNS (Period Average and Period End) suggests the direction in which inventories are moving, thereby indicating the need for an analysis of efficiency improvements and/or potential burgeoning inventory problems. INVENTORY TURNS (Period End) – same as Inventory Turns (Period Average) except that Inventory amount used in ratio is the period-ending inventory. NOTE: Comparing the two INVENTORY TURNS (Period Average and Period End) suggests the direction in which inventories are moving, thereby indicating the need for analysis of efficiency improvements and/or potential burgeoning inventory problems. Formula Net Profit / Firm Equity Period Cost of Goods Sold / Inventory (Average in Period) Period Cost of Goods Sold / Inventory (End of Period) 2 IMDA IMDA CONFERENCE 2012 - FINANCIAL RATIOS Definition DAYS INVENTORY –another way to measure Inventory Turns - shows the average length of time items are in inventory, i.e., how many days a business could continue selling using only its existing inventory. The goal, in most cases, is to demonstrate efficiency through having a high turnover rate and therefore a low days' inventory. However, realize that this ratio can be unfavorable if either too high or too low. A company must balance the cost of carrying inventory with its unit and acquisition costs. The cost of carrying inventory can be significant; some estimates run as high as 25% to 35% of inventory. These costs include warehousing, material handling, taxes, insurance, depreciation, interest and obsolescence. LIQUIDITY RATIOS CURRENT RATIO, a comparison of current assets to current liabilities, is a commonly used measure of short-run solvency, i.e., the immediate ability of a firm to pay its current debts as they come due. Current Ratio is particularly important to a company thinking of borrowing money or getting credit from its suppliers. Potential creditors use this ratio to measure a company’s liquidity or ability to pay off short-term debts. Though acceptable ratios may vary from industry to industry, a ratio below 1.00 is not atypical for high quality companies with easy access to capital markets to finance unexpected cash requirements. Smaller companies, however, should have higher current ratios to meet unexpected cash requirements. The rule of thumb Current Ratio for small companies is 2:1, indicating the need for a level of safety in the ability to cover unforeseen cash needs from current assets. Current Ratio is best compared to the industry. QUICK RATIO (or Acid Test Ratio) is a more rigorous test than the Current Ratio of short-run solvency, the current ability of a firm to pay its current debts as they come due. This ratio considers only cash, marketable securities (cash equivalents) and accounts receivable because they are considered to be the most liquid forms of current assets. A Quick Ratio less than 1.0 implies "dependency" on inventory and other current assets to meet short-term obligations and debt. DAYS SALES OUTSTANDING (DSO – Period Average), also known as Collection Period (period average), is a financial indicator that shows both the age, in terms of days, of a company’s accounts receivable and the average time it takes to turn the receivables into cash. It is compared to company and industry averages, as well as company selling terms (e.g., Net 30) for determination of acceptability by the company. DSO is calculated: DSO = (Total Receivables/Total Credit Sales in the Period Analyzed) x Number of Days in the Period Analyzed. Note: Only credit sales are to be used. Cash sales are excluded. Formula (Inventory: Average in Year / Annual Cost of Goods Sold) * 365 days Or (Inventory: Average in Period / Period Cost of Goods Sold) * Number of Days in Period Current Assets / Current Liabilities (Current Assets – Inventory) / Current Liabilities (Accounts Receivable: period average / Annual Credit Sales) *365 Or (Accounts Receivable: period average / Period Credit Sales) * Number of Days in Period 3 IMDA IMDA CONFERENCE 2012 - FINANCIAL RATIOS Definition DAYS SALES OUTSTANDING (DSO - Ending), also known as Collection Period (period ending), is a financial indicator that shows both the age, in terms of days, of a company’s accounts receivable and the average time it takes to turn the receivables into cash. It is compared to company and industry averages, as well as company selling terms (e.g., Net 30) for determination of acceptability by the company. Note: Only credit sales are to be used. Cash sales are excluded. Comparison to DSO – Period Average) may indicate the trend of AR management and the need for corrective action. DAYS PAYABLE OUTSTANDING (DPO) is an estimate of the length of time the company takes to pay its vendors after receiving inventory. If the firm receives favorable terms from suppliers, it has the net effect of providing the firm with free financing. If terms are reduced and the company is forced to pay at, or closer to, the time of receipt of goods, it reduces financing by the trade and increases the firm’s working capital requirements. DEBT MANAGEMENT RATIOS TIMES INTEREST EARNED (TIE) measures the extent to which operating income can decline before the firm is unable to meet its annual interest costs. The TIE ratio is used by bankers to assess a firm’s ability to pay their liabilities. TIE determines how many times during the year the company has earned the annual interest costs associated with servicing its debt. Normally, a banker will be looking for a TIE ratio to be 2.0 or greater, showing that a business is earning the interest charges two or more times each year. A value of 1.0 or less suggests that the firm is not earning sufficient amounts to cover interest charges. Financing sources will also look at a Fixed Charge Coverage Ratio which looks not only at interest, but also all debt service (payments on borrowings, leases, etc.) Formula (Accounts Receivable: ending / Annual Credit Sales) /365 Or (Accounts Receivable: ending / Period Credit Sales) * Number of Days in Period (Accounts Payable: average or ending / Period Purchases) *365 365 or whatever # of days there are in the Period being measured Operating Income / Interest Expense 4 IMDA IMDA CONFERENCE 2012 - FINANCIAL RATIOS Definition DEBT TO EQUITY measures the risk of the firm’s capital structure in terms of amounts of capital contributed by creditors and that contributed by owners. It expresses the protection provided by owners for the creditors. In addition, low Debt/Equity ratio implies ability to borrow. While using debt implies risk (required interest and principal payments must be paid), it also introduces the potential for increased benefits to the firm’s owners. When debt is used successfully (operating earnings exceeding interest charges) the returns to shareholders are magnified through financial leverage. Depending on the industry, different ratios are acceptable. The company should be compared to the industry, but acceptable ratios to financing sources are lower now since the financial crisis. Should a company have a high debt-to-equity ratio, it will be a major impediment to obtaining additional financing. If the ratio is suspect and you find the company’s working capital, and current / quick ratios drastically low, this is a sign of serious financial weakness. Formula Total Debt / Equity Some advantages of higher debt levels are: The deductibility of interest from business expenses can provide tax advantages. Returns on equity can be higher. Debt can provide a suitable source of capital to start or expand a business. Some disadvantages can be: Sufficient cash flow is required to service a higher debt load. The need for this cash flow can place pressure on a business if income streams are erratic. Susceptibility to interest rate increases. Directing cash flow to service debt may starve expenditure in other areas such as development which can be detrimental to overall survival of the business. 5 IMDA FIXED vs. VARIABLE COSTS 1. Definition of variable expense - an expenditure that rises and falls with "output" (usually sales volume). Expenses may be wholly variable (e.g., sales commissions), semi-variable (aka "step expenses which are fixed over limited intervals of volume and then rise to another level (think about adding a staff person), or fixed (e.g., rent). 2. Reducing "fixed" overhead is really comprised of 2 elements: a. Converting fixed expenses to variable/semi-variable expenses b. Reducing expenses that have become part of the company's "landscape" but which need to be looked at with a fresh, objective, creative eye to determine if they are truly needed or need to continue at current levels. 3. Converting fixed expenses to variable expenses a. Outsourcing certain functions is probably the most prevalent way to do this. Outsourcing has the benefits (generally) of: i. Being able to ramp up and down the level of expense based on the volume of the service/item needed in view of sales volume, as well as ii. Putting a function into the hands of a specialist/expert firm or individual whose core competency is in this service/function that is not your core competency (think "Information Technology"). b. Examples (and please note, these are just illustrative - not specific recommendations) of outsourcing as a way to vary expenditures with volume (let's acknowledge up front that any of these and other similar measures requires careful thought and consideration on the implications/consequences/controls, etc. of moving an internal function to an external third party): i. Software as a Service ("Saas") - "renting" software from a 3rd party (e.g., Microsoft and others) rather than buying and installing software on one's own hardware. This is generally priced on number of "seats" (users) and level of service. If you grow and add users, you increase the number of licensed seats/users for the software as needed. Conversely, if there's a downturn, you reduce the number of licensed seats/users and the monthly cost accordingly. ii. Cloud computing - not just software, but also hardware (servers and storage), maintenance/assuring uptime/access, remote access, upgrades and replacements, back-up for hardware, software and DATA - all turned variable based on the amount of information you need (seats, etc.). iii. Sales force - converting from full-time sales employees to independent (multi-line) sales reps generally means that you'll pay only a commission (and no base salary, benefits or expenses for travel, etc.) tied to sales revenue. Another way to accomplish this would be 6 IMDA (if feasible) to change sales force compensation from salary plus commission to commission only (with, perhaps, a recoverable "draw" against commissions to smooth cash flow for the salespeople). Of course, the commission percentage MAY be higher but will only be paid on actual sales. iii. Public warehousing/fulfillment services - many firms (e.g., UPS offering "logistics") offer space for storing, receiving and shipping inventory on a variable basis (charging for each intake of goods, shipment of goods and square (or cubic) footage that one's company uses for inventory storage monthly. Thus, if inventory declines due to lower requirements in the face of lower sales, the cost associated with inventory warehousing and logistics declines, too. iv. Payroll - outsourcing payroll, payroll tax remittance, tax filings - you pay for each filing and generally for each paycheck so you convert to variable/semi-variable cost. ADP, Paychex, or local processors can do all that for you; PEO's are another way to go). 4. Reducing fixed costs - examples a. Using (or substituting) free lancers or part-timers for full-time personnel when a function doesn't require a full-time employee or you can manage 2 p/t people to address 1 f/t job (flex scheduling). You save the cost of fringe benefits (and IF they qualify as free lancers - that is, independent contractors, you may also save on payroll taxes). Think marketing, PR, bookkeeping. b. Changing from traditional telecom services to VOIP/internet-based telecom - generally cheaper and no incremental cost based on volume or location of calls being made c. Shared services & programs - trade and professional associations can offer "group" rates they negotiate based on volume of their potential/participating members for everything from insurance (company and employee) to purchasing computers, supplies, etc. to group discounts on inventory from suppliers/manufacturers - may not be feasible based on volumes, historic relationships, etc. 7


