Math 160 - Cuyamaca College
advertisement
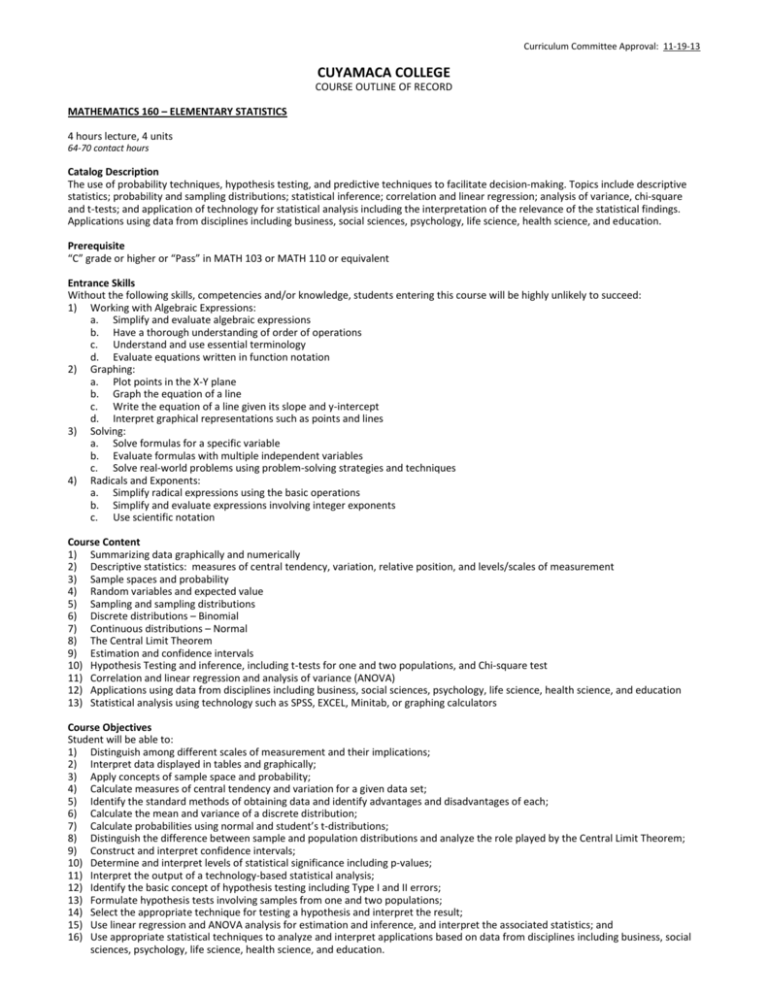
Curriculum Committee Approval: 11-19-13 CUYAMACA COLLEGE COURSE OUTLINE OF RECORD MATHEMATICS 160 – ELEMENTARY STATISTICS 4 hours lecture, 4 units 64-70 contact hours Catalog Description The use of probability techniques, hypothesis testing, and predictive techniques to facilitate decision-making. Topics include descriptive statistics; probability and sampling distributions; statistical inference; correlation and linear regression; analysis of variance, chi-square and t-tests; and application of technology for statistical analysis including the interpretation of the relevance of the statistical findings. Applications using data from disciplines including business, social sciences, psychology, life science, health science, and education. Prerequisite “C” grade or higher or “Pass” in MATH 103 or MATH 110 or equivalent Entrance Skills Without the following skills, competencies and/or knowledge, students entering this course will be highly unlikely to succeed: 1) Working with Algebraic Expressions: a. Simplify and evaluate algebraic expressions b. Have a thorough understanding of order of operations c. Understand and use essential terminology d. Evaluate equations written in function notation 2) Graphing: a. Plot points in the X-Y plane b. Graph the equation of a line c. Write the equation of a line given its slope and y-intercept d. Interpret graphical representations such as points and lines 3) Solving: a. Solve formulas for a specific variable b. Evaluate formulas with multiple independent variables c. Solve real-world problems using problem-solving strategies and techniques 4) Radicals and Exponents: a. Simplify radical expressions using the basic operations b. Simplify and evaluate expressions involving integer exponents c. Use scientific notation Course Content 1) Summarizing data graphically and numerically 2) Descriptive statistics: measures of central tendency, variation, relative position, and levels/scales of measurement 3) Sample spaces and probability 4) Random variables and expected value 5) Sampling and sampling distributions 6) Discrete distributions – Binomial 7) Continuous distributions – Normal 8) The Central Limit Theorem 9) Estimation and confidence intervals 10) Hypothesis Testing and inference, including t-tests for one and two populations, and Chi-square test 11) Correlation and linear regression and analysis of variance (ANOVA) 12) Applications using data from disciplines including business, social sciences, psychology, life science, health science, and education 13) Statistical analysis using technology such as SPSS, EXCEL, Minitab, or graphing calculators Course Objectives Student will be able to: 1) Distinguish among different scales of measurement and their implications; 2) Interpret data displayed in tables and graphically; 3) Apply concepts of sample space and probability; 4) Calculate measures of central tendency and variation for a given data set; 5) Identify the standard methods of obtaining data and identify advantages and disadvantages of each; 6) Calculate the mean and variance of a discrete distribution; 7) Calculate probabilities using normal and student’s t-distributions; 8) Distinguish the difference between sample and population distributions and analyze the role played by the Central Limit Theorem; 9) Construct and interpret confidence intervals; 10) Determine and interpret levels of statistical significance including p-values; 11) Interpret the output of a technology-based statistical analysis; 12) Identify the basic concept of hypothesis testing including Type I and II errors; 13) Formulate hypothesis tests involving samples from one and two populations; 14) Select the appropriate technique for testing a hypothesis and interpret the result; 15) Use linear regression and ANOVA analysis for estimation and inference, and interpret the associated statistics; and 16) Use appropriate statistical techniques to analyze and interpret applications based on data from disciplines including business, social sciences, psychology, life science, health science, and education. MATH 160 Page 2 of 2 Method of Evaluation A grading system will be established by the instructor and implemented uniformly. Grades will be based on demonstrated proficiency in subject matter determined by multiple measurements for evaluation, one of which must be essay exams, skills demonstration or, where appropriate, the symbol system. 1) Quizzes that measure students’ ability to describe, display and organize numerical data, and work with and apply concepts of probability including the central limit theorem. 2) Exams that measure students’ ability to carry out hypotheses tests and construct and interpret interval estimates of population parameters. 3) Computer laboratory assignments in which students will apply concepts of probability, display and analyze data using computer software, and analyze two-variable data using regression/correlation concepts along with appropriate computer software. 4) Homework that measures students’ ability to apply statistical and probability concepts to real-world applications. Special Materials Required of Student Statistical calculator (department highly recommends TI 84 Plus Graphing Calculator) Minimum Instructional Facilities 1) Smart classroom with whiteboards covering three walls, graphing utility and view screen, software (state of the art statistical software such as Minitab, word processing, spreadsheet such as Excel and other work place software), overhead projector 2) Smart math lab with 42 computers, whiteboards, software (state of the art statistical software such as Minitab, word processing, spreadsheet such as Excel and other work place software), overhead projector Method of Instruction 1) Lecture and discussion 2) Teamwork 3) Distance learning 4) Computer-facilitated instruction Out-of-Class Assignments 1) Problem sets 2) Lab activities 3) Exploratory activities and/or projects 4) Reading and/or writing assignments Texts and References 1) Required (representative examples): a. Larson, et al. Elementary Statistics: Picturing the World. 5th edition. Pearson, 2012. b. Larson, et al. Student Solutions Manual for Elementary Statistics: Picturing the World. 5th edition. Pearson, 2012. 2) Supplemental: None Exit Skills Students having successfully completed this course exit with the following skills, competencies and/or knowledge: 1) Summarize data graphically and numerically. 2) Use descriptive statistics (measures of central tendency, variation, relative position, and levels/scales of measurement) to describe a population and compare populations when appropriate. 3) Identify the sample space of an experiment or random trial. 4) Find and interpret the expected value and standard deviation of a Random variable. 5) Recognize the sampling distribution as a distribution of a sample statistic, the mean of the sampling distribution as the population mean, and the standard error of the sampling distribution as the standard deviation for the population (the Central Limit Theorem). 6) Construct and interpret confidence intervals. 7) Use hypothesis tests and inference (including t-tests for one and two populations and Chi-square test) to determine if a result is statistically significant for discrete (binomial) and continuous (normal) distributions. 8) Use analysis of variance (ANOVA) to analyze the differences between group means and their associated procedures such as variation among and between groups. 9) Perform statistical analysis using technology such as SPSS, EXCEL, Minitab, or StatCrunch. Student Learning Outcomes Upon successful completion of this course, students will be able to: 1) Summarize data graphically and numerically. 2) Use descriptive statistics (measures of central tendency, variation, relative position, and levels/scales of measurement) to describe a population and compare populations when appropriate. 3) Identify the sample space of an experiment or random trial. 4) Find and interpret the expected value and standard deviation of a Random variable. 5) Recognize the sampling distribution as a distribution of a sample statistic, the mean of the sampling distribution as the population mean, and the standard error of the sampling distribution as the standard deviation for the population (the Central Limit Theorem). 6) Construct and interpret confidence intervals. 7) Use hypothesis tests and inference (including t-tests for one and two populations and Chi-square test) to determine if a result is statistically significant for discrete (binomial) and continuous (normal) distributions. 8) Use analysis of variance (ANOVA) to analyze the differences between group means and their associated procedures such as variation among and between groups. 9) Perform statistical analysis using technology such as SPSS, EXCEL, Minitab, or StatCrunch.
