Pulley/Cart Motion
advertisement
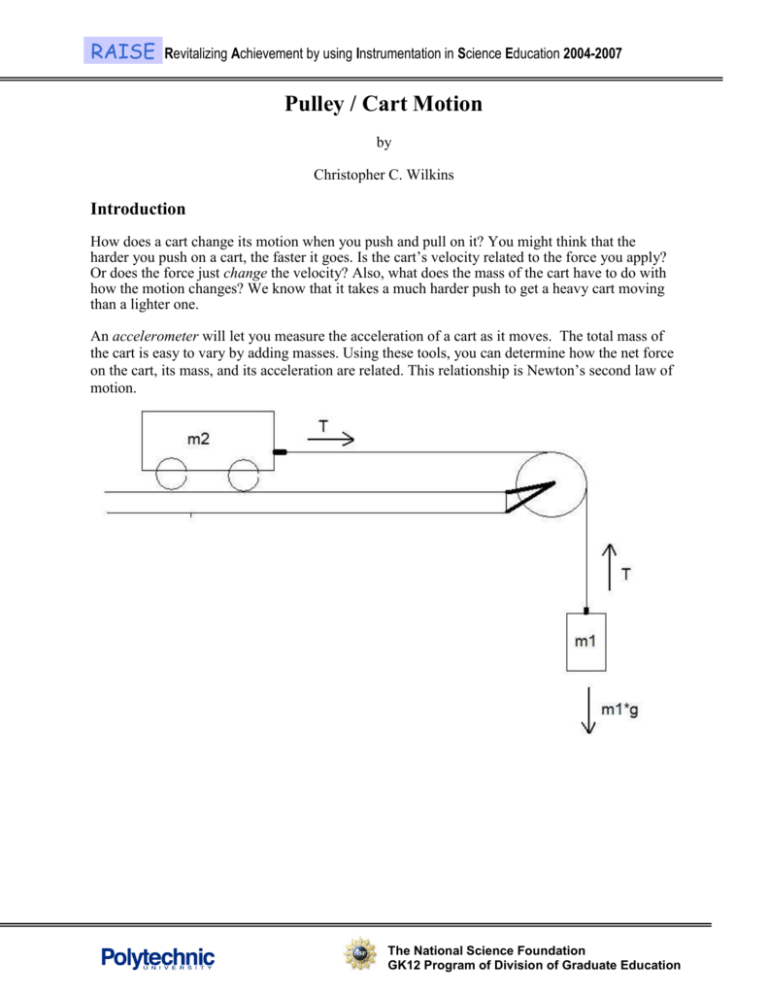
RAISE Revitalizing Achievement by using Instrumentation in Science Education 2004-2007 Pulley / Cart Motion by Christopher C. Wilkins Introduction How does a cart change its motion when you push and pull on it? You might think that the harder you push on a cart, the faster it goes. Is the cart’s velocity related to the force you apply? Or does the force just change the velocity? Also, what does the mass of the cart have to do with how the motion changes? We know that it takes a much harder push to get a heavy cart moving than a lighter one. An accelerometer will let you measure the acceleration of a cart as it moves. The total mass of the cart is easy to vary by adding masses. Using these tools, you can determine how the net force on the cart, its mass, and its acceleration are related. This relationship is Newton’s second law of motion. The National Science Foundation GK12 Program of Division of Graduate Education RAISE Revitalizing Achievement by using Instrumentation in Science Education 2004-2007 Objective Using different masses on the cart and hanging from the pulley, analyze how the acceleration of the system varies, and how the acceleration measured differs from the theoretical values due to the friction in the system. Equipment List Windows Laptop LabPro or Universal Lab Interface Pulley and string Vernier Low-g Accelerometer Logger Pro low-friction dynamics cart Various masses Experimental Procedure 1. Place a mass on the dynamics cart and HOLD IT THERE. 2. Have someone else hang an equal mass from the other end of the string and stand near it to catch the mass when it falls 3. Push COLLECT in LoggerPro to begin recording acceleration. 4. Let the cart go and when the hanging mass has been caught, click STOP. 5. Record the acceleration, and the masses of the cart ( mc ), the mass placed on the cart ( m2 ), and the hanging mass ( m1 ) in the chart below. 6. Repeat using different masses on the cart and hanging four more times. 7. Move on to the analysis section to complete the rest of the chart. Results Attempt Mass 2 (kg) Mass 1 (kg) Total Mass (kg) Experimental Acceleration (m/s^2) Theoretical Acceleration (m/s^2) % Error 1 2 3 4 5 The National Science Foundation GK12 Program of Division of Graduate Education RAISE Revitalizing Achievement by using Instrumentation in Science Education 2004-2007 Analysis USE the force analysis you learned in class to determine the theoretical acceleration of the system for each case you experimented. SHOW YOUR WORK ON THE BACK OF THIS PAGE (including FBDs of the hanging mass and the cart), and record the values calculated in the chart on the previous page. Calculate the percent error and record that as well. Remember that %err True Experimental 100 . True 1) List three causes of error of our measurements in order of importance (#1 being the most important). 2) Is it possible to add masses in a certain way so that the system doesn’t accelerate at all? Why or why not? 3) One the back of this paper: Draw a picture of a coal mining system that uses the principle tested today. Your system should be able to move people in an elevator that goes NOT up and down, but left to right in the mine shafts. Write THREE SENTENCES explaining the motion that people will feel when riding your “elevator” and how it could be a problem. The National Science Foundation GK12 Program of Division of Graduate Education
