Bio 292 problem set 3 B
advertisement

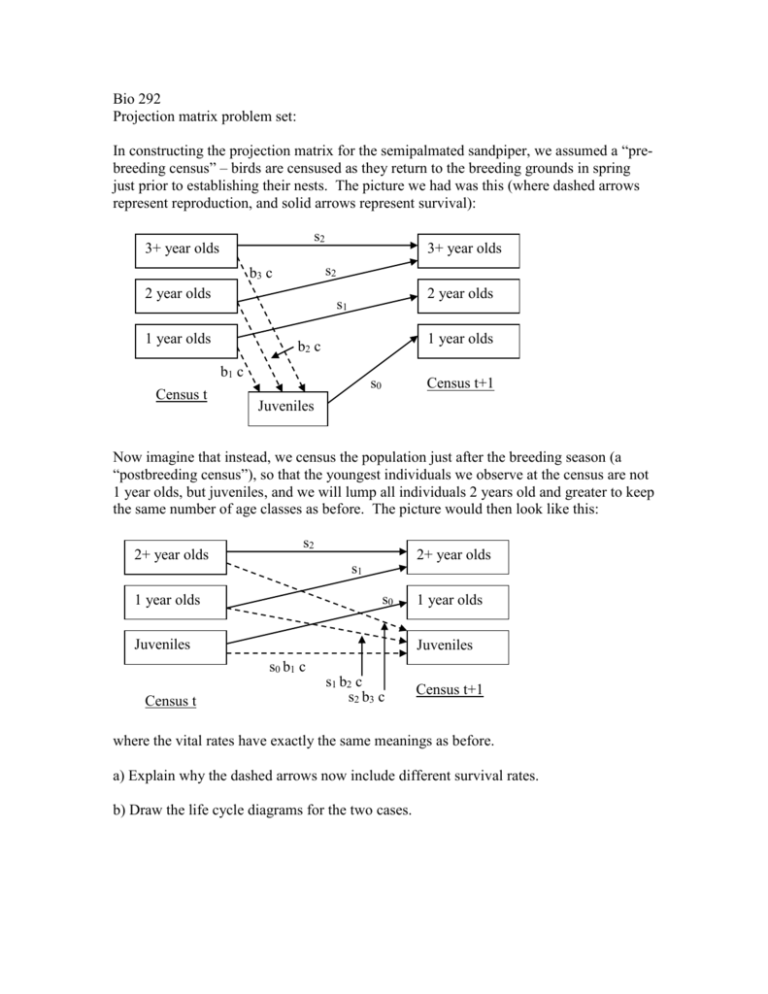
Bio 292 Projection matrix problem set: In constructing the projection matrix for the semipalmated sandpiper, we assumed a “prebreeding census” – birds are censused as they return to the breeding grounds in spring just prior to establishing their nests. The picture we had was this (where dashed arrows represent reproduction, and solid arrows represent survival): s2 3+ year olds 3+ year olds s2 b3 c 2 year olds 2 year olds s1 1 year olds 1 year olds b2 c b1 c Census t s0 Census t+1 Juveniles Now imagine that instead, we census the population just after the breeding season (a “postbreeding census”), so that the youngest individuals we observe at the census are not 1 year olds, but juveniles, and we will lump all individuals 2 years old and greater to keep the same number of age classes as before. The picture would then look like this: 2+ year olds s2 2+ year olds s1 s0 1 year olds Juveniles 1 year olds Juveniles s0 b1 c Census t s1 b2 c s2 b3 c Census t+1 where the vital rates have exactly the same meanings as before. a) Explain why the dashed arrows now include different survival rates. b) Draw the life cycle diagrams for the two cases. c) The projection matrices corresponding to the two cases are: A pre b1cs0 s1 0 b2cs0 0 s2 b3cs0 s0b1c s1b2c s2b3c 0 and A post s0 0 0 0 s2 s1 s2 Show that the eigenvalues of these two matrices are the same, as they must be (Hint: you don’t need to compute the actual eigenvalues; simply show that the characteristic equations are the same).


