11.2 Graphs of Harmonic Motion
advertisement
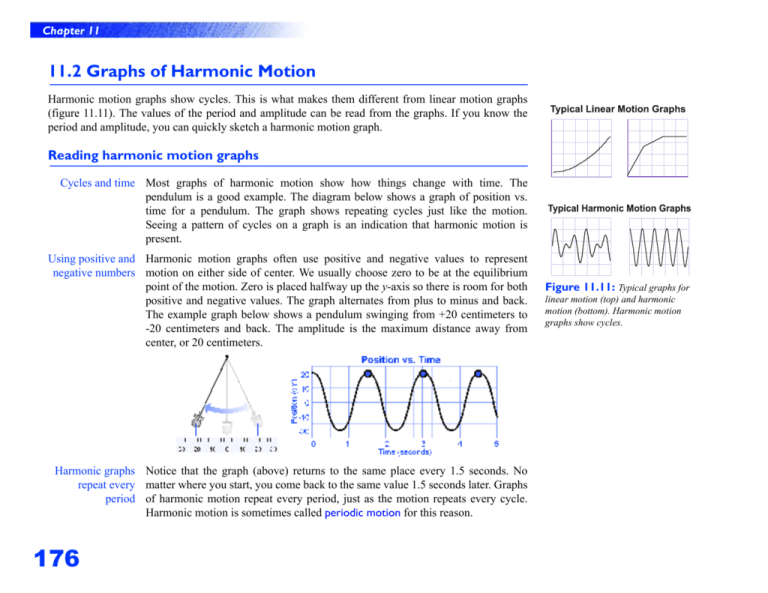
Chapter 11 11.2 Graphs of Harmonic Motion Harmonic motion graphs show cycles. This is what makes them different from linear motion graphs (figure 11.11). The values of the period and amplitude can be read from the graphs. If you know the period and amplitude, you can quickly sketch a harmonic motion graph. Reading harmonic motion graphs Cycles and time Most graphs of harmonic motion show how things change with time. The pendulum is a good example. The diagram below shows a graph of position vs. time for a pendulum. The graph shows repeating cycles just like the motion. Seeing a pattern of cycles on a graph is an indication that harmonic motion is present. Using positive and Harmonic motion graphs often use positive and negative values to represent negative numbers motion on either side of center. We usually choose zero to be at the equilibrium point of the motion. Zero is placed halfway up the y-axis so there is room for both positive and negative values. The graph alternates from plus to minus and back. The example graph below shows a pendulum swinging from +20 centimeters to -20 centimeters and back. The amplitude is the maximum distance away from center, or 20 centimeters. Harmonic graphs Notice that the graph (above) returns to the same place every 1.5 seconds. No repeat every matter where you start, you come back to the same value 1.5 seconds later. Graphs period of harmonic motion repeat every period, just as the motion repeats every cycle. Harmonic motion is sometimes called periodic motion for this reason. 176 Figure 11.11: Typical graphs for linear motion (top) and harmonic motion (bottom). Harmonic motion graphs show cycles. Chapter 11 Determining amplitude and period from a graph Calculating The amplitude is half the distance between the highest and lowest points on the amplitude graph. For the example in figure 11.12, the amplitude is 20 centimeters, as from a graph illustrated by the calculation below. The difference between the highest and lowest value of the graph is the peak-to-peak value. Figure 11.12: The amplitude of a Calculating period To get the period from a graph, start by identifying one complete cycle. The cycle from a graph must begin and end in the same place on the graph. Figure 11.13 shows how to choose the cycle for a simple harmonic motion graph and for a more complex one. Once you have identified a cycle, you use the time axis of the graph to determine the period. The period is the time difference between the beginning of the cycle and the end. Subtract the beginning time from the ending time, as shown in the example below. wave is one-half the peak-to-peak distance. In this graph of harmonic motion, the amplitude of the wave is 20 centimeters. Figure 11.13: The cycle is the part of the graph that repeats over and over. The gray shading shows one cycle for each of the graphs above. Before you can find the period, you need to identify the cycle. 11.2 Graphs of Harmonic Motion 177 Chapter 11 Circles and harmonic motion Circular motion Circular motion is very similar to harmonic motion. For example, a turning wheel returns to the same position every 360 degrees. Rotation is a cycle, just like harmonic motion. One key difference is that cycles of circular motion always have a length of 360 degrees. It does not matter how big the wheel is, each full turn is 360 degrees. Figure 11.14 shows a shadow of a peg on a rotating wheel. As the wheel rotates, the shadow of the peg goes back and forth on the wall. If we make a graph of the position of the shadow, we get a harmonic motion graph. The period of the cycle is exactly the time it takes the wheel to turn 360 degrees. The phase of We often use degrees to tell us where we are within the cycle of an oscillator. For an oscillator example, how would you identify the moment when the pendulum was one-tenth of the way through its cycle? If we let one cycle be 360 degrees, then one-tenth of that cycle is 36 degrees. Thirty-six degrees is a measure of the phase of the oscillator. The word “phase” means where the oscillator is in the cycle. What do we mean The concept of phase is important when comparing one oscillator with another. by “in phase”? Suppose we have two identical pendulums, with exactly the same period. If we start them together, their graphs would look like the picture below. We describe the two pendulums as being in phase because cycles are aligned. Each oscillator is always at the same place at the same time. Both pendulums in phase 178 Figure 11.14: The shadow of a peg moves back and forth on the wall as the turntable rotates. The shadow itself appears to be in harmonic motion. Chapter 11 Out of phase If we start the first pendulum swinging a little before the second one, the graphs by 90 degrees look like the diagram below. Although, they have the same cycle, the first pendulum is always a little ahead of the second. The graph shows the lead of the first pendulum as a phase difference. Notice that the top graph reaches its maximum 90 degrees before the bottom graph. We say the two pendulums are out of phase by 90 degrees, or one-fourth of a cycle. 90 degrees out of phase Out of phase When they are out of phase, the relative motion of the oscillators may differ by a by 180 degrees little or by as much as half a cycle. Two oscillators 180 degrees out of phase are one-half cycle apart. The next diagram (below) shows that the two pendulums are always on opposite sides of the cycle from each other. The concepts of in phase and out of phase will be very important to our Investigations with waves and sound. 180 degrees out of phase 11.2 Graphs of Harmonic Motion 179

