Research US: Fed hiking cycle: an early start but a slow pace
advertisement
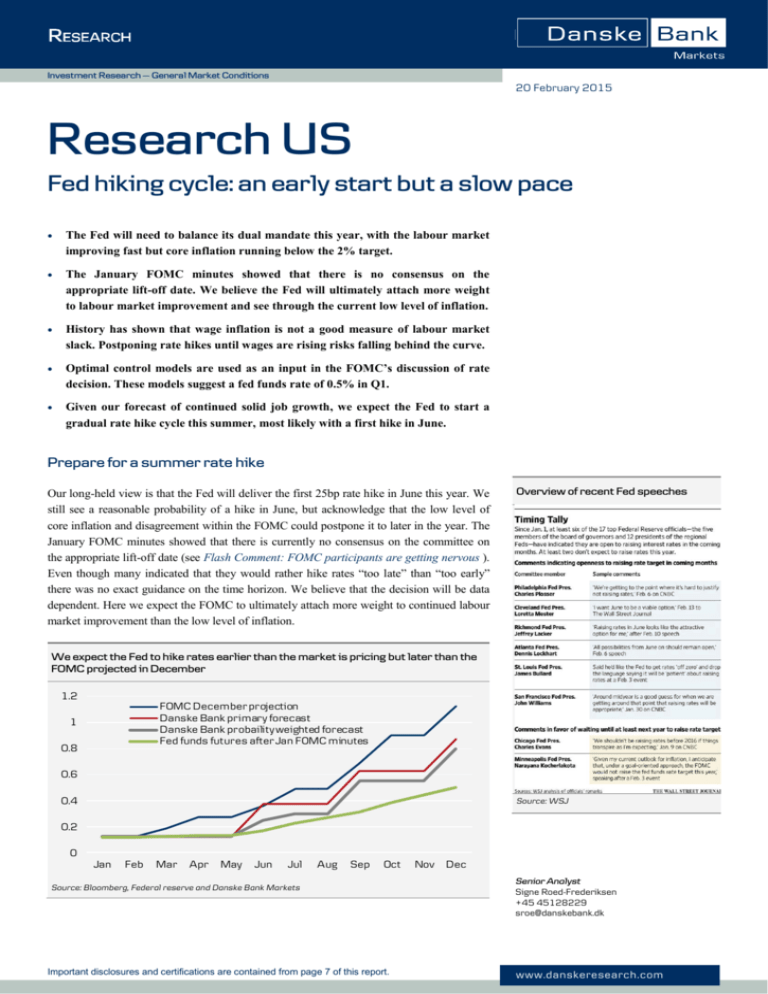
Investment Research — General Market Conditions 20 February 2015 Research US Fed hiking cycle: an early start but a slow pace The Fed will need to balance its dual mandate this year, with the labour market improving fast but core inflation running below the 2% target. The January FOMC minutes showed that there is no consensus on the appropriate lift-off date. We believe the Fed will ultimately attach more weight to labour market improvement and see through the current low level of inflation. History has shown that wage inflation is not a good measure of labour market slack. Postponing rate hikes until wages are rising risks falling behind the curve. Optimal control models are used as an input in the FOMC’s discussion of rate decision. These models suggest a fed funds rate of 0.5% in Q1. Given our forecast of continued solid job growth, we expect the Fed to start a gradual rate hike cycle this summer, most likely with a first hike in June. Prepare for a summer rate hike Our long-held view is that the Fed will deliver the first 25bp rate hike in June this year. We still see a reasonable probability of a hike in June, but acknowledge that the low level of core inflation and disagreement within the FOMC could postpone it to later in the year. The January FOMC minutes showed that there is currently no consensus on the committee on the appropriate lift-off date (see Flash Comment: FOMC participants are getting nervous ). Even though many indicated that they would rather hike rates “too late” than “too early” there was no exact guidance on the time horizon. We believe that the decision will be data dependent. Here we expect the FOMC to ultimately attach more weight to continued labour market improvement than the low level of inflation. Overview of recent Fed speeches We expect the Fed to hike rates earlier than the market is pricing but later than the FOMC projected in December 1.2 FOMC December projection Danske Bank primary forecast Danske Bank probaility weighted forecast Fed funds futures after Jan FOMC minutes 1 0.8 0.6 0.4 Source: WSJ 0.2 0 Jan Feb Mar Apr May Jun Jul Aug Sep Oct Source: Bloomberg, Federal reserve and Danske Bank Markets Important disclosures and certifications are contained from page 7 of this report. Nov Dec Senior Analyst Signe Roed-Frederiksen +45 45128229 sroe@danskebank.dk www.danskeresearch.com Research US We think that the FOMC speeches following the very strong January employment report give support to this view (see overview on previous page). We will likely be a bit wiser next week when Janet Yellen delivers her semi-annual testimony on Tuesday 24 February. We attach the following probabilities of an initial 25bp rate hike to the upcoming meetings: 17 June 50%, 29 July 20%, 17 September 30% (we attach a higher probability to September than July because of the scheduled press conference). Once the Fed starts the hiking cycle, we think they will take a gradual approach. With core inflation running below the 2% target until late 2016, we think the Fed will deliver around 100bp in rate hikes the first year. We expect the Fed to increase the hiking pace in late 2016 where core inflation approaches 2% and the labour market has tightened significantly. We present the arguments for our view below. In contrast to our gradual hiking pace forecast, the market is pricing a slower hiking cycle and a later start. This means that there is scope for higher market rates in the US over the coming year. Labour market improvement is significant As is evident in the chart below, the labour market is currently in a better state on most measures than when the Fed started the previous hiking cycle in June 2004. Employer behaviour has been positive, with January posting the strongest three-month job growth rate since 1997 and JOLTS data on job openings and hires much better than in 2004. Leading indicators, such as initial claims, the level of employment in the temporary help service sector and the number of firms reporting that they were unable to fill job openings (from the NFIB survey), are also encouraging. Labour market in a better shape than when the 2004 hiking cycle started (outwards moves indicate stronger labour market) Payroll employment Temporary help services employment Leading June 2004 June 2014 January 2015 Job openings Employer behavior Unable to fill job openings Hires Initial claims The index is comparing the labour market conditions in recent months with June 2004 (Index=100) where the Fed initiated the latest hiking cycle Hiring plans Job finding Job availability Part time for economic reason Utilization (slack) Marginally attached Quits Confidence Unemployment Source: BLS, JOLTS, Macrobond Financial, Danske Bank Markets Note: The figure shows the level of tightness of different US labour market key figures at different times, compared to the level of the same figures in June 2004 (Index=100). Counter cyclical figures (Unemployment rate, jobless claims, marginally attached, and work part time for economic reasons) are inverted, thus the higher index (the further from the middle) the better (tighter) is the state for the labour market. 2 | 20 February 2015 www.danskeresearch.com Research US Confidence measures such as the share of firms in the NFIB survey that plan to increase employment, the ‘plentiful jobs’ measure in the Conference Board survey and the number of employees who left voluntarily are all close to or above the June 2004 level. What stands out are the measures of utilisation or slack, which are generally weak. This suggest that underemployment remains an issue even though the unemployment rate has dropped from 10% at the peak to the current 5.7%. Given the extremely low level of the fed funds rate, the current level of underemployment is not enough to keep hikes off the table, in our view. It rather serves as a reason why the Fed will initially keep the pace of hikes slow. Remember, at the time the 2004 hiking cycle started, the fed funds rate was 1.0% and therefore closer to the long-term neutral fed funds rate than is currently the case. GDP and Danske Bank forecast Source: BEA and Danske Bank Markets estimates We expect GDP growth to reach 3.0% this year and 2.5% in 2016 (for details see Research US: Revising down H1 GDP growth ). This is well above potential growth, which the CBO estimates at 1.7% this year and should support continued job growth at an average of 250,000 per month in 2015. Assuming a moderate pickup in labour force growth, the unemployment rate should reach 4.9% by year-end. GDP growth should keep payrolls at 250K on average this year Unemployment rate to reach new and lower NAIRU in October Source: BEA and Danske Bank Markets estimates Source: BLS and Danske Bank Markets estimates We find it likely that the FOMC will reduce its estimate of the NAIRU at the upcoming March meeting, a guesstimate is from the current 5.4% to around 5.0%. If our forecast on the unemployment rate is right, the NAIRU should be reached in October this year. We think this is consistent with a fed funds rate in the range of 0.5% to 0.75%. Core inflation to stay low but Fed to focus on the outlook Trimmed mean PCE suggest a more modest downward pressure on prices One argument that is often referred to by the doves of the FOMC, is that there are no signs of wage inflation and with core inflation running below the 2% target, the Fed should wait to hike. We do not agree on this view, as we argue below, but it does give the Fed a good reason to proceed gradually with policy normalisation. First, it is true that core inflation, measured by the core PCE, is low and will likely remain below the Fed’s 2% target until the end of next year. However, the Fed will respond to the outlook for inflation and not the current level as highlighted by Chairman Yellen at the press conference following the 16-17 December FOMC meeting (see Flash Comment: FOMC meeting - It all depends on the data). Some of the factors dragging down core 3 | 20 February 2015 Source: Dallas Fed, BEA, Danske Bank Markets www.danskeresearch.com Research US inflation now are likely to be transitory and reflect partly lower import prices and indirect price effects from lower energy costs. Also, remember that in 1999, the FOMC began the hiking cycle with core PCE at 1.4% y/y – not far from the current 1.3% y/y. Survey-based longer-term inflation expectations have not moved much despite the current low level of headline inflation and we think the Fed takes a lot of comfort in this. However, there seems to be an increasing discomfort with the decline in market-based inflation expectations. Since the January FOMC meeting, market-based inflation expectations have stabilised, and with the oil price now stabilising and set to move gradually higher during 2015, headline inflation and inflation expectations should bottom in coming months. 5y5y forward breakeven inflation and oil prices Source: Bloomberg and Danske Bank Markets Core PCE and forecast Longer-term inflation expectations Source: BEA, Danske Bank Markets estimates Source: University of Michigan, Bloomberg, Macrobond Financial, Federal Reserve Note: Dark (light) shading indicates periods of tightening (easing) Second, history suggest that wage inflation is not a particularly good measure of labour market slack or underlying inflation pressure. There is a risk that policy makers will get behind the curve if rate hikes are postponed until wage inflation is back at more normal levels. This is the lesson from the past two recoveries following the 1990 and 2001 recessions. The charts below show the wage Phillips curve, defined as the relationship between wage inflation and the unemployment rate starting in 1990 and 2000 respectively and plotted for the following 7-8 years. Phillips Wage curve 1990-1998 Wage Phillips curve 2000-2007 Wage Phillips curve 2008-2014 (Q4) Source: BLS, BEA, Danske Bank Markets Source: BLS, BEA, Danske Bank Markets Source: BLS, BEA, Danske Bank Markets 4 | 20 February 2015 www.danskeresearch.com Research US As is evident from the charts, wage inflation remains subdued despite a rapid improvement in the unemployment rate following the recession. The exact same picture is seen in current data. An explanation for this pattern is downward nominal wage rigidities. Employers are hesitant to reduce wages and workers reluctant to accept wage cuts, even during recessions. As the economy recovers, there is an accumulated stockpile of pent-up wage cuts which has to be worked off before wages can start growing again. In response, businesses hold back wage increases until inflation and productivity bring wages back to near their desired level again. The upshot is that wage inflation should not be taken as a better indicator of the degree of slack in the labour market than the unemployment rate. Further, once the pent-up wage decreases have been worked off, wage inflation tends to shoot up rapidly. Waiting to hike the fed funds rate until there is clear evidence that wage inflation is moving higher would risk the Fed falling significantly behind the curve, particularly when the starting point for the fed funds rate is 0.125%. This risk was highlighted by Yellen in her Jackson Hole Speech August 2014 with a reference to this research paper from the San Francisco Fed which is also available in a more current version. Wage pressures are rising in some sectors Source: NFIB, BEA and Danske Bank Markets ULC suggest much more price pressure than wage data The minutes from the January FOMC meeting suggest that there is disagreement within the FOMC on wage dynamics. However, with both Yellen and San Francisco Fed President Williams (voter, centrist) calling for a cautious approach to wage inflation data, we believe that the most influential members of the FOMC are in that camp. Third, if we adjust the current low level of wage inflation for productivity growth and look at unit labour costs instead, the message is that the low level of productivity is putting upward pressure on production costs despite low wage inflation. Source: BLS, BEA and Danske Bank Markets Optimal control policy suggests rate hike now The FOMC has stated several times that in order to facilitate a faster return to lower unemployment the fed funds rate should be kept lower than under normal circumstances. Optimal control policy path with 2012 and late 2014 data – compared to December median of FOMC projections for the Fed funds rate Dec FOMC projections OC - Late 2012 OC - Late 2014 5 4.5 4 3.5 3 2.5 2 1.5 1 0.5 2022Q3 2022Q1 2021Q3 2021Q1 2020Q3 2020Q1 2019Q3 2019Q1 2018Q3 2018Q1 2017Q3 2017Q1 2016Q3 2016Q1 2015Q3 2015Q1 2014Q3 2014Q1 2013Q3 2013Q1 2012Q3 2012Q1 0 Source: Federal Reserve, Danske Bank Markets 5 | 20 February 2015 www.danskeresearch.com Research US This has been supported by so-called Optimal Control (OC) models1 for monetary policy which Chairman Yellen made reference to in her famous November 2012 speech. As she highlighted, the optimal path for the fed funds rate under such a model suggested a significantly later lift-off date for the fed funds rate than more simple approaches such as a Taylor rule. The thinking is that in order to get the unemployment rate down towards the long-term natural level fast, the central bank could allow the inflation rate to overshoot the target for some time. A recent note published on the Federal Reserve website shows the same OC model but using current economic data. The model now suggest a much earlier increase in the fed funds rate than back in 2012, with a first hike in Q4 2015. Another interesting result from the model simulations is that an early hike followed by a gradual increase in the fed funds rate is to be preferred over a later hike with a more aggressive hiking cycle afterwards. This supports our view that the Fed will prefer an early start to the hiking cycle followed by a gradual pace of increase afterwards. 1 Optimal control models for monetary policy basically estimate the policy that minimises the policy makers’ loss function cumulated over time. For the Fed, the loss function is often defined as a weighted average of inflation deviation from target, unemployment deviation from its long run normal value and a loss from changes in the fed funds rate, which reflects a desire to avoid abrupt changes in the policy instrument. 6 | 20 February 2015 www.danskeresearch.com Research US Disclosures This research report has been prepared by Danske Bank Markets, a division of Danske Bank A/S (‘Danske Bank’). The author of the research report is Signe Roed-Frederiksen, Senior Analyst. Analyst certification Each research analyst responsible for the content of this research report certifies that the views expressed in the research report accurately reflect the research analyst’s personal view about the financial instruments and issuers covered by the research report. Each responsible research analyst further certifies that no part of the compensation of the research analyst was, is or will be, directly or indirectly, related to the specific recommendations expressed in the research report. Regulation Danske Bank is authorised and subject to regulation by the Danish Financial Supervisory Authority and is subject to the rules and regulation of the relevant regulators in all other jurisdictions where it conducts business. Danske Bank is subject to limited regulation by the Financial Conduct Authority and the Prudential Regulation Authority (UK). Details on the extent of the regulation by the Financial Conduct Authority and the Prudential Regulation Authority are available from Danske Bank on request. The research reports of Danske Bank are prepared in accordance with the Danish Society of Financial Analysts’ rules of ethics and the recommendations of the Danish Securities Dealers Association. Conflicts of interest Danske Bank has established procedures to prevent conflicts of interest and to ensure the provision of highquality research based on research objectivity and independence. These procedures are documented in Danske Bank’s research policies. Employees within Danske Bank’s Research Departments have been instructed that any request that might impair the objectivity and independence of research shall be referred to Research Management and the Compliance Department. Danske Bank’s Research Departments are organised independently from and do not report to other business areas within Danske Bank. Research analysts are remunerated in part based on the overall profitability of Danske Bank, which includes investment banking revenues, but do not receive bonuses or other remuneration linked to specific corporate finance or debt capital transactions. Financial models and/or methodology used in this research report Calculations and presentations in this research report are based on standard econometric tools and methodology as well as publicly available statistics for each individual security, issuer and/or country. Documentation can be obtained from the authors on request. Risk warning Major risks connected with recommendations or opinions in this research report, including a sensitivity analysis of relevant assumptions, are stated throughout the text. Date of first publication See the front page of this research report for the date of first publication. General disclaimer This research has been prepared by Danske Bank Markets (a division of Danske Bank A/S). It is provided for informational purposes only. It does not constitute or form part of, and shall under no circumstances be considered as, an offer to sell or a solicitation of an offer to purchase or sell any relevant financial instruments (i.e. financial instruments mentioned herein or other financial instruments of any issuer mentioned herein and/or options, warrants, rights or other interests with respect to any such financial instruments) (‘Relevant Financial Instruments’). The research report has been prepared independently and solely on the basis of publicly available information that Danske Bank considers to be reliable. While reasonable care has been taken to ensure that its contents are not untrue or misleading, no representation is made as to its accuracy or completeness and Danske Bank, its affiliates and subsidiaries accept no liability whatsoever for any direct or consequential loss, including without limitation any loss of profits, arising from reliance on this research report. The opinions expressed herein are the opinions of the research analysts responsible for the research report and reflect their judgement as of the date hereof. These opinions are subject to change, and Danske Bank does not undertake to notify any recipient of this research report of any such change nor of any other changes related to the information provided in this research report. 7 | 20 February 2015 www.danskeresearch.com Research US This research report is not intended for retail customers in the United Kingdom or the United States. This research report is protected by copyright and is intended solely for the designated addressee. It may not be reproduced or distributed, in whole or in part, by any recipient for any purpose without Danske Bank’s prior written consent. Disclaimer related to distribution in the United States This research report is distributed in the United States by Danske Markets Inc., a U.S. registered broker-dealer and subsidiary of Danske Bank, pursuant to SEC Rule 15a-6 and related interpretations issued by the U.S. Securities and Exchange Commission. The research report is intended for distribution in the United States solely to ‘U.S. institutional investors’ as defined in SEC Rule 15a-6. Danske Markets Inc. accepts responsibility for this research report in connection with distribution in the United States solely to ‘U.S. institutional investors’. Danske Bank is not subject to U.S. rules with regard to the preparation of research reports and the independence of research analysts. In addition, the research analysts of Danske Bank who have prepared this research report are not registered or qualified as research analysts with the NYSE or FINRA but satisfy the applicable requirements of a non-U.S. jurisdiction. Any U.S. investor recipient of this research report who wishes to purchase or sell any Relevant Financial Instrument may do so only by contacting Danske Markets Inc. directly and should be aware that investing in nonU.S. financial instruments may entail certain risks. Financial instruments of non-U.S. issuers may not be registered with the U.S. Securities and Exchange Commission and may not be subject to the reporting and auditing standards of the U.S. Securities and Exchange Commission. 8 | 20 February 2015 www.danskeresearch.com

