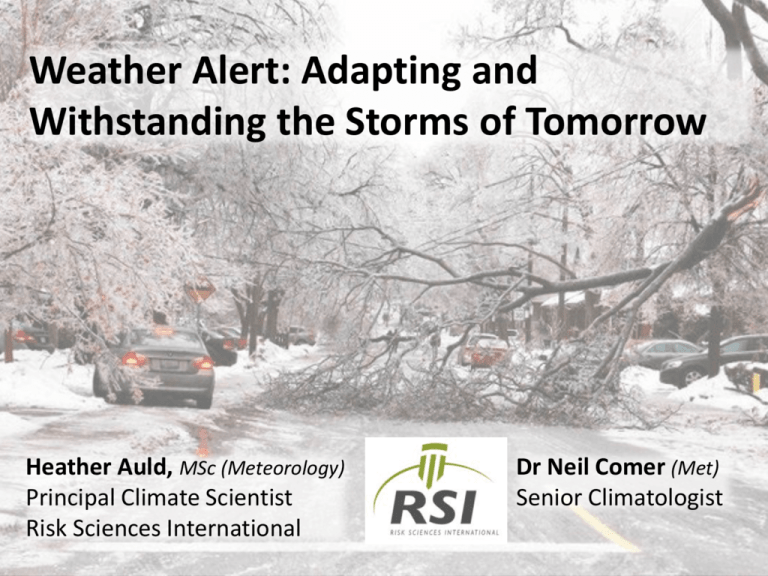
Weather Alert: Adapting and Withstanding the Storms of Tomorrow
advertisement

Weather Alert: Adapting and Withstanding the Storms of Tomorrow Heather Auld, MSc (Meteorology) Principal Climate Scientist Risk Sciences International Dr Neil Comer (Met) Senior Climatologist Will Canada be ready for the next natural disaster? Toronto Star, May 27, 2014 Recent survey of disaster management professionals finds most are concerned about extreme weather events, but don’t have funding to prepare for them. (Toronto Star) Toronto's July flood ranked as most costly natural disaster in Ontario history 100 Top 3 Emergency risks for Ontario municipalities 90 % municpalities 80 70 60 50 Weather Weather Non-weather 40 30 20 10 0 Weather is now the predominant risk factor for property insurers. Rising Costs of Weather Extremes • • • • • August, 2005 Heavy rainfall in GTA … >$600M Alberta flooding, June, 2013…. >$2B July 8, 2013 rainstorm in GTA … $850M - $1Billion Southern Ontario ice storm, December, 2013 … $250M, counting U.S. weather-related losses since 1980 … ~>$1Trillion Climate Change and “4” Cornerstones of Resilience Projections/Monitoring Response/Learning From “Resilience Engineering in Practice: A Guidebook” What to expect; Update knowledge Thresholds; Gaps; Able to Detect Detected; Emergency response; Operations Forensics; Fix it! Resilience (1&2): Anticipation and Monitoring The climate change evidence has become stronger… Irreversible Unequivocal warming 22 years Scientists tend to be cautious in making statements – need evidence Many More Climate Change Models Today … Increasingly sophisticated IPCC 1995 11 GCMs IPCC 2001 14 GCMs IPCC 2007 24 GCMs IPCC 2013 40 GCMs! Mean Annual Temperature Trends: Ongoing Warming Our Near …Future 2020s Annual Temperature (AR5-RCP8.5) Present … 1981-2010 Average Annual Temperature Past …Future 1951-1980 Average Temperature Mid-Century … Average 2050sAnnual Average Annual Temperature (AR5-RCP8.5) 9 8 118 8 Mean Annual Precipitation Trends: Becoming Wetter Our Present … 1981-2010 Average Annual Precipitation Near …Future 2020s Annual Precipitation (AR5-RCP8.5) Past Mid-Century …Future 1951-1980 Average …Average 2050s Annual Average Precipitation Annual Precipitation (AR5-RCP8.5) 1100 1100 1000 900 1000 900 1000 900 900 800 800 (mm) The Science is Valid… The Evidence grows Stronger Small changes in climate will matter… As thresholds are approached Removed Figure showing analyses of actual insurance losses and number of claims (comprising ~95% of ALL insurance claims filed) vs peak wind speeds and threshold since results still under publication. Results from analyses of insurance claims and wind gust extreme data indicate that insurance claims for this southern Ontariomunicipality increase >~500% for a 15% increase in wind speeds above threshold of ~90kph. For further details, contact Risk Sciences International Wind force increases generally with wind speed squared Critical Freezing Rain Thresholds for Above Ground Power Line Failures – Eastern North America Failures under Extreme Ice Storms - freezing rain (mm) mm Communication towers >40 Transmission line failures Distribution line failures – ice loads 25-30 Distribution Line Outages – tree breakage 12-20 Slippery roads <10 How do Small Changes Lead to Catastrophic Failure????? Failure Impact of age on structure Impact of unforeseen weathering Load Safety Factor Capacity Design Capacity Design Load Change of use over time For example – population growth Severe climate event (Courtesy Engineers Canada; Nodelcorp) Changes in Weathering… day-to-day weather Climate Information & Infrastructure Performance Structures Ice & Snow Loads Extreme Rain (Intensity, Duration, Freq) Extreme Winds Roads, Bridges Road safety, Flooding risks, Operations. Deterioration FAILURE RISKS – Failure risks drainage & for signs, erosion some bridge components Electrical power distribution structures FAILURE RISKS Underground, Vaults, Towers if widespread flooding FAILURE RISKS Buildings (including airports) FAILURE RISKS Flooding; failure risk FAILURES Risk of failure Risks to infrastructure services The changing climate and Uncertainties • Most Confidence More CERTAINTY • Least / Less Confident Less CERTAINTY More heat More severe More ice storms Warmer waves More winter intense winters precipitation rainfalls Increase in Longer growing wind extremes season (frost-free) Recommendation: Use multiple climate change models Global and Local Temperature Changes will be very sensitive to Ongoing and Future Accumulated GHGs The “reality” RCP8.5 Recommendation: Use multiple climate change models & realistic GHG assumptions Latest Climate Change Projections for Toronto area Precipitation (RCP8.5 emissions, ensemble) … Wetter • Figure removed • % Change/increases in Toronto area precipitation (mean, extremes) relative to 1981-2010 conditions using the latest IPCC AR5 projections (40 climate models) • Projections for 2020s, 2050s, 2080s • For more details, see Risk Sciences International Mean Annual Precipitation Change One Day Max Precipitation Change Five Day Max Precipitation Change Daily Precipitation Intensity Index Important: Always use multiple climate change models % Increase for Dec-Feb months The Mix of Precipitation will also change… Probable increases in longer lasting ice storms Future Time Period From: Cheng et al, 2007 & 2011 Climate Change is here to stay… Resilience (3&4): Response and Learning Range of adaptation actions: From “no/low regrets” for current climate to incorporation of future climate “Low hanging fruit”… “higher up the tree”… • Updated climate data and improvements for codes & standards; • New standards for climate change adaptation (e.g. new Northern CSA standards, IDF standard) • PIEVC vulnerability assessments (current + future climate) • Vulnerability/Forensic studies – “at risk” regions & infrastructure, learning from failures • Added safety factors, longer return periods, more redundancy • Maintenance, maintenance – ↑ weathering; • Consider “win-win” solutions (e.g. energy efficiency) Starting Point: Existing Vulnerabilities Flooding Risks in Peel Region and neighbouring Municipalities Courtesy TRCA Adaptation Choices for Climate & Weather Resilience New approaches Do nothing Strengthen existing & new (e.g. safety factors; return periods; retrofits) Current Climate (e.g. district cooling) Manage extremes Monitor; Improve science (e.g. disaster planning; PIEVC risk assessment) With Climate Change DESIGN (new/existing) Add Resilience; Safety factor; Return period; Stage; Flexible Include future climate (PIEVC); codes/standards OPERATIONS (existing/new) Improve (Repair & retrofit; maintenance) Financial (insurance; Mun. reserves) Mainstreaming Climate Change into Decisions Moving beyond NATO (“No Action Talk Only”) to Action • Meaningful climate information • “Due diligence” – best practices, not perfect • Multi-disciplinary • Support from regulations, codes, standards, legal community… PIEVC Climate Change Vulnerability Assessment Northern Training Series Mainstreaming climate change science Traditional approach Risk management approach Climate model-led Risk-Thresholds-led What if climate extremes change according to scenarios x, y, z? What can infrastructure cope with? “Thresholds”, priorities for action? Climate Change Models Climate sensitivities? Vulnerabilities? Sensitivities? Impacts? Failure thresholds? Lifespan? Is Adaptation needed? Risk? Various adaptation options? No No new measures. Yes New measures needed. Are new adaptation measures needed by ~ 20xx? Flexible adaptation options working with Infrastructure Lifecycle Timeframes Structures Expected Lifecycle Houses/Buildings Retrofit/alterations 15-20 yrs Demolition 50-100 yrs Sewer Major upgrade 50 yr Dams/Water Supply Refurbishment 20-30 yrs Reconstruction 50 yrs Bridges Maintenance annually Resurface concrete 20-25 yrs Reconstruction 50-100 yrs Improved Asset management More Intense Rainfall & Precipitation Events • • • • • • Intense thunderstorms, tropical moisture, major weather systems, snowmelt + rainfall… CC Projection: ~40% increase in days with rainfall > 25mm Implications: Increased failures – culverts, rail, bridges, flooding, reservoirs, water treatment, building… Riverine and urban flooding risks will differ Responses: Good rainfall data, updated climate design values, codes & standards, lifecycle replacement to higher standards, backflow valves, berms… But, challenges to incorporating climate change extremes into designs, codes, standards Adaptation Examples: Extreme Rainfall Municipalities, Conservation Authorities: • More rainfall data, better rainfall design values • Low impact development: • • Rain gardens Roof collection • Stormwater infrastructure upgrades • Back-water valves & sump pumps; Downspout disconnects Listen to Berta, Ryan, Fabio Municipalities, Michigan: • Home owner water credit for increasing infiltration, rain water collection • Tax credit for planting approved trees Staged Adaptation and Flood Protection Landforms: Berms and Toronto’s Don River (Corktown Common) Park “the meadows that will save Bay Street”… New park doubles as flood protection for downtown financial district • Brownfield site on Western bank of lower Don River • $135M - doubles as a 8.5-metre-high berm designed to protect the eastern downtown from a major flood (~500 year r.p., approx. H Hazel) • Passed the July 8, 2013 test for downtown protection… elsewhere? • Additional protection can be added – height, land for biodiversity • Adaptation response to a largely impervious watershed Winter Storms, Extreme Winds: Risk Implications • Projections: Shorter snow season, nil snow periods…BUT • POTENTIAL for more intense snow storms (Gulf of Mexico moisture, bigger storms) • Lake effect snow will continue to increase… for some time • Potential for ~ 40% increase in days with winds > 90 kph • Implications: Transportation operations, all infrastructure (winds), salt use, building ice damming & roof damage, power and communications outages • Critical infrastructure and Public safety concerns • Responses: Enhanced emergency planning, codes & standards, tree trimming, enhanced maintenance, added safety factors Jan, 2014, Amherstburg Adaptation Examples: Winter storms CSA S502 Changing Snow Load standard for North: Under public review City of Ottawa, other Municipalities: Winter road and sidewalk maintenance, By-Law • New equipment for ice breakage • New maintenance practices – Mixed precipitation, flooding and flash freeze - all in one day; Road Weather Information Systems – equipment, prediction sensitive Toronto Hydro & Ontario Power Authority PIEVC risk assessments • Ice storm ‘98 recommendations • Tree trimming Listen to Ivano Anchorage and Life-saving Tornado Measures: NBCC & CSA Increasing Climate Resilience through new and updated Codes and Standards • Many have outdated climate values (Highway & Bridge Code) • National Building Code of Canada 2015: Option to include CC adaptation, given scientific evidence • New CSA standards (IDFs) and New Northern CSA standards • Changes to & new Codes/Standards: Require “evidence” • Need forensic analyses – learn from failures, vulnerabilities Changing Climate and Uncertainties • Climate change: Imperfect data and perpetual uncertainty… now adding another layer of uncertainty • Uncertainty is not new nor a good reason for inaction • Opportunity costs associated with inaction • Can’t fix, harden, replace, or climate-proof everything – have to prioritize • Must use multiple climate change models • A stitch in time saves four - $1 invested in prevention saves $4 in response… or $15! Engineers Canada PIEVC Vulnerability Assessments: Tools, Training and Lessons Learned 25 Canadian & two international risk assessments… Some common issues. For example: • Combinations & sequences of events can have more impact than discrete events. • Infrastructure systems are almost always vulnerable to interruptions in power supply Online Climate Resilience System Training available: http://climateresilientsystems.com/ Climate Change: Risk Management for a Moving Target Thank You! For further information, contact: Heather Auld Risk Sciences International hauld@risksciences.com


