Determinants of Eating Quality - California Avocado Commission
advertisement
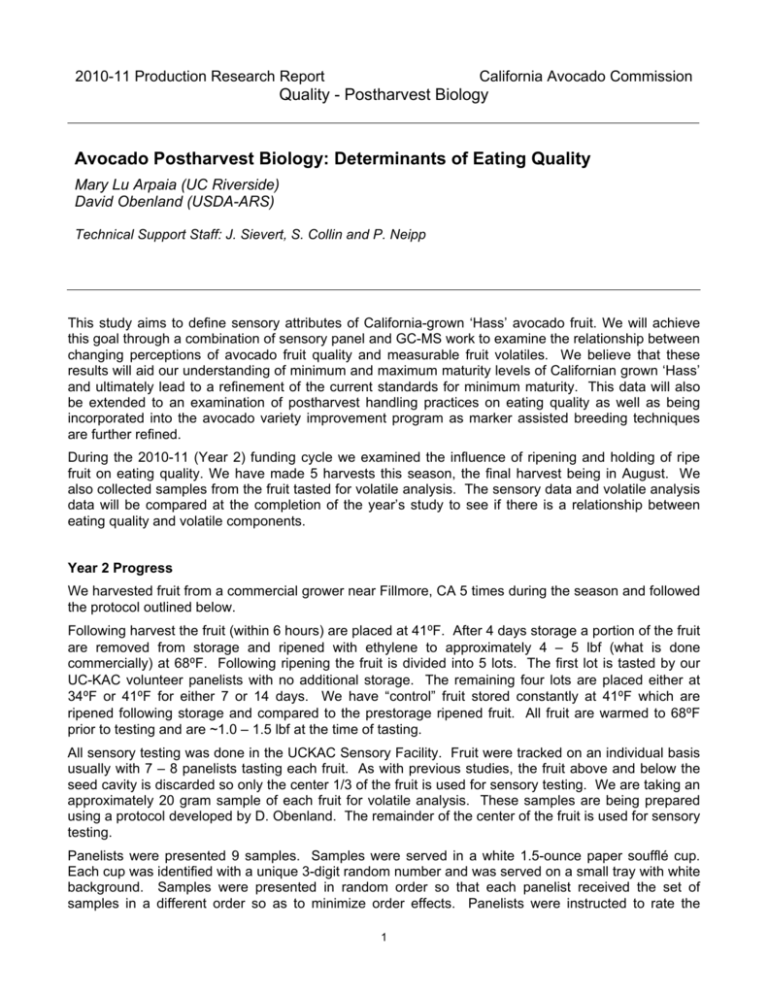
2010-11 Production Research Report California Avocado Commission Quality - Postharvest Biology Avocado Postharvest Biology: Determinants of Eating Quality Mary Lu Arpaia (UC Riverside) David Obenland (USDA-ARS) Technical Support Staff: J. Sievert, S. Collin and P. Neipp This study aims to define sensory attributes of California-grown ‘Hass’ avocado fruit. We will achieve this goal through a combination of sensory panel and GC-MS work to examine the relationship between changing perceptions of avocado fruit quality and measurable fruit volatiles. We believe that these results will aid our understanding of minimum and maximum maturity levels of Californian grown ‘Hass’ and ultimately lead to a refinement of the current standards for minimum maturity. This data will also be extended to an examination of postharvest handling practices on eating quality as well as being incorporated into the avocado variety improvement program as marker assisted breeding techniques are further refined. During the 2010-11 (Year 2) funding cycle we examined the influence of ripening and holding of ripe fruit on eating quality. We have made 5 harvests this season, the final harvest being in August. We also collected samples from the fruit tasted for volatile analysis. The sensory data and volatile analysis data will be compared at the completion of the year’s study to see if there is a relationship between eating quality and volatile components. Year 2 Progress We harvested fruit from a commercial grower near Fillmore, CA 5 times during the season and followed the protocol outlined below. Following harvest the fruit (within 6 hours) are placed at 41⁰F. After 4 days storage a portion of the fruit are removed from storage and ripened with ethylene to approximately 4 – 5 lbf (what is done commercially) at 68⁰F. Following ripening the fruit is divided into 5 lots. The first lot is tasted by our UC-KAC volunteer panelists with no additional storage. The remaining four lots are placed either at 34⁰F or 41⁰F for either 7 or 14 days. We have “control” fruit stored constantly at 41⁰F which are ripened following storage and compared to the prestorage ripened fruit. All fruit are warmed to 68⁰F prior to testing and are ~1.0 – 1.5 lbf at the time of tasting. All sensory testing was done in the UCKAC Sensory Facility. Fruit were tracked on an individual basis usually with 7 – 8 panelists tasting each fruit. As with previous studies, the fruit above and below the seed cavity is discarded so only the center 1/3 of the fruit is used for sensory testing. We are taking an approximately 20 gram sample of each fruit for volatile analysis. These samples are being prepared using a protocol developed by D. Obenland. The remainder of the center of the fruit is used for sensory testing. Panelists were presented 9 samples. Samples were served in a white 1.5-ounce paper soufflé cup. Each cup was identified with a unique 3-digit random number and was served on a small tray with white background. Samples were presented in random order so that each panelist received the set of samples in a different order so as to minimize order effects. Panelists were instructed to rate the 1 samples in the order presented. They were also instructed to rinse their mouth with the distilled water prior to beginning and between each sample to minimize carry-over effects between samples and to take a small bite of carrot before rinsing their mouths with water. The carrots serve as a palette cleanser between samples. The panelists are asked to rate the fruit using a 9-point hedonic rating (dislike extremely – like extremely) as well as rating the intensity of 4 characteristics using 150 mm line scales. They were asked to rate watery/creamy/dry, bland/rich avocado flavor, nuttiness and grassiness. The measured distance from the 0-point indicated the intensity of the sensory attribute, with a greater number indicating higher intensity of each characteristic. We have completed a preliminary analysis of the data. D. Obenland has provided the data to the USDA statistician for more detailed analysis. In our opinion the results are somewhat surprising. In terms of storage quality and visual appearance at the time of final evaluation, there were no differences detected. In fact, there were virtually no storage problems encountered throughout the harvest season. Storage of the nearly ripe fruit at 34⁰F did not result in increased cold damage, similar to what has been previously reported. Table 1 presents the average fruit weight, the average dry weight and minimum and maximum dry weight for each harvest. Note that even though we were well past the release date for Hass avocado, they average dry weight for the first harvest was below the minimum legal standard. Also note the wide range in dry weight values for each harvest. Table 1. Average fruit weight and dry weight for fruit harvested in 2011 from a commercial grower near Fillmore, CA. Average fruit Average dry Harvest Date weight (g) weight (%) 15-Mar-11 219.3 b 19.8 c 27-Apr-11 242.3 b 23.5 b 8-Jun-11 249.6 ab 27.9 a 13-Jul-11 281.1 a 29.1 a 17-Aug-11 278.6 a 29.2 a Dry weight determined on 10 individual fruit. Mean separation at the 0.05% probability level using LSD. Minimum DW (%) 18.0 18.9 23.1 26.6 26.0 Maximum DW (%) 21.4 27.2 31.8 31.3 34.4 With regard to the sensory analysis, as would be expected, there were significant differences due to harvest date. The hedonic ratings for the fruit increased as fruit maturity progressed (Harvests 1-4) but slightly declined for the August evaluation (Harvest 5) (Table 2). This may be due to the slight increase in dryness of the flesh tissue. Fruit from the final harvest was also rated as less rich flavored and nutty. The first two harvests also had significantly lower hedonic ratings than the fruit harvest in June and July. These fruit were rated as significantly more bland and grassy, and less nutty in flavor. This is in line with data we collected in Year 1 of this project for lower maturity fruit. In general, storage after ripening for either 1 or 2 weeks in comparison to fruit held at 41⁰F in storage then ripened following storage had no significant effect on any sensory parameter regardless of storage temperature (Table 3). The only exception as the rating for fruit creaminess; in this case fruit that was held for 1 week after ripening at 34⁰F was rated slightly less creamy. This trend was not observed when fruit were held for 2 weeks following ripening. Since there were virtually no differences between treatments in terms of eating quality, we elected to only conduct volatile analysis for fruit harvested in June 7 (27.9% DW). At this harvest although there were no differences in hedonic rating between the 3 storage durations, fruit that were held for either 7 days or 14 days were rated significantly different in terms of flesh texture as well as slightly more bland, less nutty and having more grassy flavor as compared to the 41⁰F control. An analysis of the volatile 2 data indicated that the fruit held for 14 days had significantly more hexanal in the fruit tissue. This compound is known to impart a “grassy” flavor and would explain the more “grassy” rating by the panelists. The data we collected this season has important ramifications to the handling and marketing of nearlyripe avocados: 1) Storage of nearly ripe fruit (4 – 5 lbf) for up to 2 weeks did not significantly alter the ripe quality of the fruit either from a physical perspective (internal discoloration, decay) or eating quality perspective. This is good news since fruit are routinely ripened then shipped to final destination. It is common for ripe fruit to be in the marketing chain for up to 1 week prior to sale. 2) Nearly ripe fruit can successfully be held at 32⁰F following ripening without fear of quality loss. This is good news since it means that nearly ripe avocados can be shipped in mixed loads (down to 3234⁰F. 3) Eating quality of the fruit appears to be more affected by fruit maturity. This observation is in line with the data collected in the previous year of this study. Table 2. The influence of harvest date and storage, not including ripening, on the sensory evaluation of Hass avocado. Harvest1 0d 7d 14d Harvest 2 0d 7d 14d Harvest 3 0d 7d 14d Harvest 4 0d 7d 14d Harvest 5 0d 7d 14d Hedonic Watery/dryZ Bland/richY NuttyY GrassyY 5.8 a 5.9a 6.1a 64.6 a 68.1a 68.2a 69.7 b 72.3ab 80.5a 60.0 a 61.5a 66.4a 57.3b 68.9a 60.4ab 6.2a 6.5a 6.2a 71.8a 72.8a 71.7a 75.9a 79.6a 74.0a 60.1a 67.9a 58.7a 64.0a 59.3a 55.7a 7.1a 7.1a 6.8a 70.2b 78.6a 78.7a 109.9a 99.3b 99.4b 101.6a 78.8b 77.3b 37.6b 47.5a 48.1a 7.1a 7.1a 7.0a 89.6a 92.2a 89.2a 104.4a 101.7a 97.7a 74.2b 88.4a 82.1ab 42.8a 46.1a 44.1a 6.8a 6.4b 6.8a 89.5b 102.0a 83.5b 94.6a 88.5a 94.2a 88.4a 73.7b 78.2b 51.2a 42.0b 44.3ab Overall Effect Harvest (H) *X * * * * Storage (S) NS * NS NS NS H*S * * * * * Z Watery/dry was rated on a 150 mm line scale where “creamy” texture was midpoint (75 mm) on the scale. Values less than 75 would tend towards “watery” texture and values greater than 75 would tend towards “dry” texture. Y Bland/rich, nutty and grassy were rated on individual 150 mm line scales where a score of “0” was none and “150” was most intense. X Significance = 0.05 (*). Mean separation within each harvest using LSD. 3 Table 3. The influence of harvest date and storage following ripening on the sensory evaluation of Hass avocado. Hedonic One week post-ripening Harvest (H) 1 5.9c 2 6.5b 3 7.1a 4 7.1a 5 6.4b Storage after ripening (S) None 6.6 6.6 7d, 34⁰F 6.6 7d, 41⁰F Effect H *X S NS H*S NS Two weeks post-ripening Harvest (H) 1 6.1b 2 6.2b 3 6.8a 4 7.0a 5 6.8a Storage after ripening (S) None 6.6 6.5 14d, 34⁰F 6.6 14d, 41⁰F Watery/dryZ Bland/richY NuttyY GrassyY 68.1d 72.8cd 78.6c 92.4b 102.0a 72.3c 79.6bc 99.3a 101.7a 88.5b 61.5c 67.9bc 78.8ab 88.4a 73.7b 68.9a 59.3b 47.5c 46.0c 42.0c 79.4b 85.9a 79.5b 88.9 87.9 88.9 73.7 74.7 74.9 54.7 51.4 53.9 * * * * NS NS * NS NS * NS NS 68.2c 71.7c 78.7b 89.2a 83.4ab 80.5b 74.0b 99.4a 97.7a 94.2a 66.4b 58.7b 77.3a 82.1a 78.2a 60.4a 55.7ab 48.1bc 44.1c 44.3c 78.1 80.1 76.2 89.4 88.5 89.8 73.6 71.9 72.1 50.0 51.0 51.1 Overall Effect H * * * * * S NS NS NS NS NS H*S NS * NS NS NS Z Watery/dry was rated on a 150 mm line scale where “creamy” texture was midpoint (75 mm) on the scale. Values less than 75 would tend towards “watery” texture and values greater than 75 would tend towards “dry” texture. Y Bland/rich, nutty and grassy were rated on individual 150 mm line scales where a score of “0” was none and “150” was most intense. X Significance = 0.05 (*). Mean separation using LSD. 4

