Determination of Caffeine in Some Sudanese Beverages
advertisement
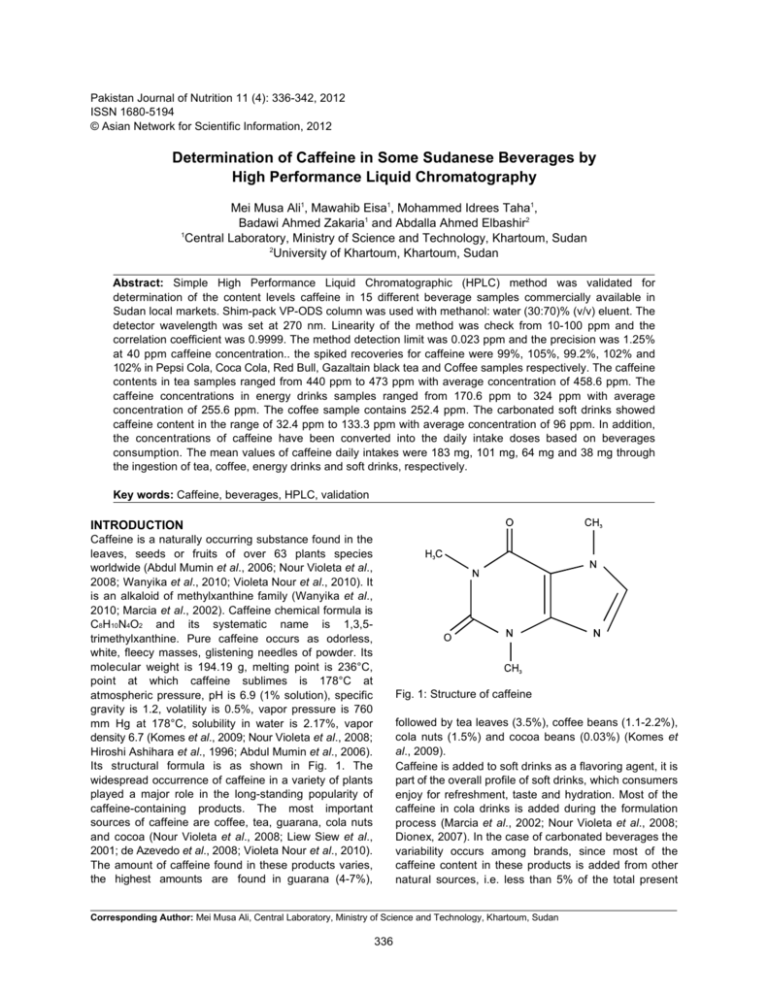
Pakistan Journal of Nutrition 11 (4): 336-342, 2012 ISSN 1680-5194 © Asian Network for Scientific Information, 2012 Determination of Caffeine in Some Sudanese Beverages by High Performance Liquid Chromatography Mei Musa Ali1, Mawahib Eisa1, Mohammed Idrees Taha1, Badawi Ahmed Zakaria1 and Abdalla Ahmed Elbashir2 1 Central Laboratory, Ministry of Science and Technology, Khartoum, Sudan 2 University of Khartoum, Khartoum, Sudan Abstract: Simple High Performance Liquid Chromatographic (HPLC) method was validated for determination of the content levels caffeine in 15 different beverage samples commercially available in Sudan local markets. Shim-pack VP-ODS column was used with methanol: water (30:70)% (v/v) eluent. The detector wavelength was set at 270 nm. Linearity of the method was check from 10-100 ppm and the correlation coefficient was 0.9999. The method detection limit was 0.023 ppm and the precision was 1.25% at 40 ppm caffeine concentration.. the spiked recoveries for caffeine were 99%, 105%, 99.2%, 102% and 102% in Pepsi Cola, Coca Cola, Red Bull, Gazaltain black tea and Coffee samples respectively. The caffeine contents in tea samples ranged from 440 ppm to 473 ppm with average concentration of 458.6 ppm. The caffeine concentrations in energy drinks samples ranged from 170.6 ppm to 324 ppm with average concentration of 255.6 ppm. The coffee sample contains 252.4 ppm. The carbonated soft drinks showed caffeine content in the range of 32.4 ppm to 133.3 ppm with average concentration of 96 ppm. In addition, the concentrations of caffeine have been converted into the daily intake doses based on beverages consumption. The mean values of caffeine daily intakes were 183 mg, 101 mg, 64 mg and 38 mg through the ingestion of tea, coffee, energy drinks and soft drinks, respectively. Key words: Caffeine, beverages, HPLC, validation INTRODUCTION Caffeine is a naturally occurring substance found in the leaves, seeds or fruits of over 63 plants species worldwide (Abdul Mumin et al., 2006; Nour Violeta et al., 2008; Wanyika et al., 2010; Violeta Nour et al., 2010). It is an alkaloid of methylxanthine family (Wanyika et al., 2010; Marcia et al., 2002). Caffeine chemical formula is C8H10N4O2 and its systematic name is 1,3,5trimethylxanthine. Pure caffeine occurs as odorless, white, fleecy masses, glistening needles of powder. Its molecular weight is 194.19 g, melting point is 236°C, point at which caffeine sublimes is 178°C at atmospheric pressure, pH is 6.9 (1% solution), specific gravity is 1.2, volatility is 0.5%, vapor pressure is 760 mm Hg at 178°C, solubility in water is 2.17%, vapor density 6.7 (Komes et al., 2009; Nour Violeta et al., 2008; Hiroshi Ashihara et al., 1996; Abdul Mumin et al., 2006). Its structural formula is as shown in Fig. 1. The widespread occurrence of caffeine in a variety of plants played a major role in the long-standing popularity of caffeine-containing products. The most important sources of caffeine are coffee, tea, guarana, cola nuts and cocoa (Nour Violeta et al., 2008; Liew Siew et al., 2001; de Azevedo et al., 2008; Violeta Nour et al., 2010). The amount of caffeine found in these products varies, the highest amounts are found in guarana (4-7%), Fig. 1: Structure of caffeine followed by tea leaves (3.5%), coffee beans (1.1-2.2%), cola nuts (1.5%) and cocoa beans (0.03%) (Komes et al., 2009). Caffeine is added to soft drinks as a flavoring agent, it is part of the overall profile of soft drinks, which consumers enjoy for refreshment, taste and hydration. Most of the caffeine in cola drinks is added during the formulation process (Marcia et al., 2002; Nour Violeta et al., 2008; Dionex, 2007). In the case of carbonated beverages the variability occurs among brands, since most of the caffeine content in these products is added from other natural sources, i.e. less than 5% of the total present Corresponding Author: Mei Musa Ali, Central Laboratory, Ministry of Science and Technology, Khartoum, Sudan 336 Pak. J. Nutr., 11 (4): 336-342, 2012 caffeine is from cola nuts. Cola like drinks account for 80 to 90% of the caffeine added to foods today (Violeta Nour et al., 2010). Caffeine is a pharmacologically active substance and depending on the dose, can be a mild central nervous system stimulant, improve cardiac performance, increase brain circulation, and exhibit vasodilatory and diuretic effect. It is also increase heartbeat rate, dilate blood vessels and elevate levels of free fatty acids and glucose in plasma. 1 g of caffeine leads to insomnia, nervousness, nausea, ear ringing, flashing of light derillum and tremulosness. In cases of overdosing and in combination with alcohol, narcotics and some other drugs, these compounds produce a toxic effect, sometimes with lethal outcome (Mamina and Pershin, 2002; Ben Yuhas, 2002; Wanyika et al., 2010; James et al., 1990; Tavallali and Sheikhaei, 2009). Caffeine dose not accumulate in the body over the course of time and is normally excreted within several hours of consumption (Nour Violeta et al., 2008). Caffeine is considered to be a risk factor for cardiovascular diseases and may affect behaviour effects of depression and Caffeine is one of the most comprehensively studied ingredients in the food supply, with centuries of safe consumption in foods and beverages. In 1959, the United State Food and Drug Administration (USFDA) designated caffeine in cola drinks as "Generally Recognized As Safe" (GRAS). The FDA considers caffeine safe for all consumers, including children. In 1987, following extensive review, the FDA "found no evidence to show that the use of caffeine in carbonated beverages would render these products injurious to health." More than 140 countries have specifically considered the safety of caffeine and allow its use in beverages at various levels (Nour Violeta et al., 2008). Caffeine was classified as a drug of abuse by the International Olympic Committee (IOC) when present in urine at concentration levels of more than 12 µg/mL. As it is the case with any food, the composition of soft drinks is regulated by legislations. According to Directive 2000/13/EC, quinine and/or caffeine used as a flavoring in the production or preparation of a foodstuff must be mentioned by name in the list of ingredients immediately after the term "flavoring". In addition, according to Directive 2002/67/EC of 18 July 2002, drinks containing caffeine in excess of 150 mg/L must also provide a warning message on the label followed by an indication of the caffeine content such that: "High caffeine content (X mg/100 mL)". Therefore, the determination of caffeine compounds in soft and energy drinks for assurance of food safety and quality control is mandatory (Violeta Nour et al., 2010). Several analytical techniques have been developed for the determination of Caffeine and the quality control of products containing Caffeine. For the determination of Caffeine in beverages, various analytical techniques including titrimetry, spectrophotometry, derivative spectrophotometry (G¨uzin Alpdogan et al., 2002), polarography, NIR-spectroscopy, capillary electrophoresis, voltametric techniques (Ahmad et al., 2005), GC (Liew Siew et al., 2001) and HPLC have been reported (Nour Violeta et al., 2008). Titrimetric methods suffer the disadvantage of using a large amount of sample and undergoing interference from many redox reagents with the determination. The polarographic method requires long analysis and suffers interferences from electrochemical impurities present in the food sample, whereas the enzymatic technique is generally considered to be too specialized for ordinary chemical laboratory use. Spectrophotometry is a fast and simple method for caffeine determination, but it cannot be used in samples with complex matrices because of background correction and techniques have been proposed such as thermal decomposition, direct ultraviolet irradiation alkaline treatment and an enzymatic method. Some visible spectrophotometric methods often require tedious pre-separation techniques to remove possible interferences from colored materials (G¨uzin Alpdogan et al., 2002). The most popular methods for caffeine determination in beverages are those which involve use of reversedphase liquid chromatography. These methods have been used to determine caffeine levels in coffee, tea, and soft drinks (Michael et al., 1985). In Sudan, there is no authentic data about caffeine content in beverages; hence this present research study has been aimed to assess the compliance of the concentration levels of caffeine in some beverages available from local markets in Sudan. In this study we validate simple revered-phase HPLC method for caffeine determination in carbonated soft drinks, energy drinks, tea and coffee. MATERIALS AND METHODS Experimental: All reagents used in this study were of analytical or HPLC grade and all solutions were prepared by using distilled water. Standard solution preparation: Caffeine stock standard solution of 1000 ppm was prepared by dissolving 0.1000 gram of caffeine standard (Sigma- Aldrich) in 80 mL distilled water and sonicated for 10 min. Then solution was transferred to 100 mL volumetric flask and the volume was completed to mark by distilled water. The stock solution was stored in dark places at +4°C. Working standard solutions were prepared by suitable dilution for stock solution and they were prepared freshly. Sample preparation: Different kinds of beverages brands including regular and diet cola, energy drinks, tea and coffee were purchased from different local 337 Pak. J. Nutr., 11 (4): 336-342, 2012 supermarkets and 15 samples were analyzed using the HPLC method. All measurements were performed in triplicate. (Shimadzu Corporation, Kyoto, Japan). All chromatographic results were acquired and processed by Empower software (Waters Corporation). The experimental conditions are mentioned in Table 1. Soft drinks samples preparation: Once sample bottles were opened, the drinks were degassed by sonication, homogenized and filtered. Then each sample was filtered through a 0.45 µm syringe filter with a 5 mL syringe. Filtered drink sample of 2 mL were 5 times diluted in distilled water. 20 µl of each diluted sample was injected into the HPLC column. The relative peak areas were determined for three replicates of each dilute sample. Then the concentration of each dilute sample and finally the concentration of caffeine in soft drinks samples were calculated from calibration curve. One sample of Pepsi cola, Coca cola, energy drink (Red Bull) was spiked with 20 ppm caffeine standard for recovery determination. RESULTS AND DISCUSSION Method validation Precision: The analytical precision of the method was assessed from the reproducibility of 6 determinations of 40 ppm caffeine solution and a relative standard deviation of 1.25% was calculated for peak area. The retention time of caffeine was 7,347 min, with a relative standard deviation RSD = 0.5% therefore, in standard solutions, the HPLC method provides stable retention times. Detection and quantification limits: Table 2 summarizes the method detection limit (MDL) and Method Quantification Limit (MQL). MDL was estimated as Standard Deviation (SD) of the peak area of seven injections multiplied by 3.14 (at n = 7). MQL was calculated by multiplying SD by 10 (Dionex, 2007). Tea and coffee samples preparation: 2.00 g of tea and coffee samples were weighed and put into 250 mL beakers.100 mL of boiling distilled water was added and let to stand for five minutes with stirring, the solution was cooled and filtered into conical flasks. 5 mL of the filtrate were pipetted into clean 50 mL volumetric flasks and made to the mark with the distilled water. The samples were filtered through 0.45 µm syringe filter and run in the HPLC system according to experimental conditions. Tea and coffee samples were spiked with 20 ppm caffeine standard for recovery determination. Linearity: The calibration graph was generated using 20 µl injection loop. Six different concentrations of caffeine from 10 ppm to 100 ppm were analyzed according to experimental conditions. Then the calibration curve was established according to the obtained response (peak area) and the concentrations of caffeine in standard solutions. The results show a good linear relationship. The calibration data was summarized in Table 3. The calibration graph is shown in Fig. 2. Instrumentation: The HPLC system used in this study was isocratic Waters HPLC, which consisted of a model 1515 isocratic pump, vacuum degasser and 2996 PDA detector (USA). The injector was a model 7725i Rheodyne injector with injection loop 20 µL. The analytical column used was Shim-pack VP-ODS with internal diameter 4.6 mm and length 250 mm Table 1: Experimental conditions Item Conditions Eluente methanol: distilled water (30:70)% (v/v) Eluente Flow Rate 1.3 mL/min Injection volume 20 µl Analytical column Shim-pack VP-ODS (250x4.6) mm Column temperature Ambient Detector PDA Detection UV 270 nm Table 2: Method detection and quantification limits for caffeinea SD of peak area for seven replicates (ppm) 0.0074 a Standard Concentration was 1 ppm Fig. 2: Calibration curve Calculated MDL (ppm) 0.023 Table 3: Regression data and statistical parameters for caffeine calibration curve Correlation coefficient R2 Slope (m) 0.9999 52726.95 338 Y-Intercept 10839.55 Calculated MQL (ppm) 0.07 Linear range (ppm) 10-100 Pak. J. Nutr., 11 (4): 336-342, 2012 Table 4: Recoveries of caffeine from spiked beverages samples Amounta of caffeine Amount of caffeine Sample name in sample (ppm) added (ppm) Pepsi cola 18.68±0.40 20 Coca cola 18.29±0.48 20 Red bull 52.62±0.65 20 Gazaltain black tea 47.29±0.26 20 Coffee 25.24±1.60 20 a Average±Standard deviation (n = 3) Amount of caffeine found (ppm) 38.47±0.80 39.30±2.00 72.46±0.35 67.70±1.50 45.64±0.40 Recovery percentage (%) 99.0 105.0 99.2 102.0 102.0 Table 5: Results of caffeine contents in beverage samples Sample Caffeine Con.±SDa Caffeine Con.±SD Daily Sample type name (ppm or mg/L) (ppm or mg/kg) intakesb (mg) Carbonated soft drinks Coca cola 102.8±0.35 41.12 Rich cola 77.0±0.50 30.80 Vita cola 32.4±0.30 12.80 Cola light 121.0±0.23 48.40 Pepsi cola 106.2±0.77 42.40 Pepsi max 133.3±0.20 53.20 Pepsi diet 114.8±0.35 45.60 Vitaene C 81.3±0.80 32.52 Energy drinks Red bull 324.0±0.80 81.00 Boom boom 273.0±0.60 68.25 Tornado 170.6±0.22 42.65 Black tea Gazaltein 473.0±0.26 23645.0±0.26 189.20 Lipton 440.0±2.00 22000.0±2.00 176.00 Mobile 463.0±1.80 23152 .0±1.80 185.20 Coffee Ethiopian 252.4±1.60 12620.0±1.60 100.96 a Average ± Standard deviation (n = 3). b - based on a 400 mL/day beverage consumption by a 70 kg adult (for carbonated soft drinks, black tea and coffee, 250 mL/day beverage consumption by a 70 kg adult for energy drinks) Recovery: For recovery study one sample of known caffeine concentration form different types of beverages was spiked with 20 ppm of caffeine standard and recovery was calculated as summarized in Table 4. As shown in Table 4 the mean recoveries of the obtained results were found to be not significantly different from the value of added caffeine concentration. Determination of caffeine contents in beverages samples: The validated method was used to determine the concentration of caffeine in real beverages samples (carbonated soft drinks, energy drink, coffee and tea). Figure 3-6 present the chromatogram obtained for the one of the injections of caffeine standard (20 ppm) and the beverages samples, respectively. The highest caffeine concentration in beverages samples was obtained in tea sample (black tea); this was followed by energy drinks then coffee sample. The least was obtained in carbonated soft drinks. The caffeine content levels in carbonated soft drinks, Energy drinks, tea and coffee respectively are presented in Table 5. The caffeine contents in tea samples ranged from 440 ppm to 473 ppm with average concentration of 458.6 ppm. The caffeine concentrations in energy drink samples ranged from 170.6 ppm to 324 ppm with average concentration of 255.6 ppm. The coffee sample contains 252.4 ppm. The analyzed samples in the Fig. 3: Chromatogram of caffeine standard 20 ppm carbonated soft drink group showed caffeine content in the range of 32.4 ppm to 133.3 ppm with average concentration of 96 ppm. It was observed that the caffeine concentrations in diet carbonated soft drinks (Cola Light, Pepsi Max and Pepsi Diet) are higher than caffeine content in regular carbonated soft drinks (Coca Cola, Rich Cola, Vita Cola and Pepsi Cola) since their mean concentrations level were of 123 ppm and 79.6 ppm respectively. All over the world, the caffeine contents in soft drinks varies according to the type of the brand, yet its average content in soft drinks is approximately 18 mg per six ounces (i.e. 100 ppm). In fact, the US Food and Drug Administration (FDA) limits the maximum caffeine amount in carbonated beverages to 6 mg/oz (200 ppm) (Violeta Nour et al., 2010). 339 Pak. J. Nutr., 11 (4): 336-342, 2012 Fig. 4: Chromatogram of Coca Cola samples Fig. 5: Chromatogram of energy drink sample (Boom Boom) Clearly, the caffeine mean content level in the analyzed carbonated beverage samples marketed in Sudan is well below the above food industry guidelines. In this current study it was found that tea contains higher level of caffeine than coffee. This is in agreement with previous work reported by Wanyika et al. (2010). particular population group and in order to estimate the daily intake of caffeine in Sudan, the following assumptions have been put forward: one of the drink is consumed daily by every adult person. However, the size of the carbonated soft drinks bottles varied considerably (330, 350 and 500 mL) and energy drinks bottles (250/mL). On average, two to three cups of tea and coffee are consumed daily, the cups size are varied from (100-225 mL), hence, daily consumption rate of 400 mL of carbonated soft drinks, tea and coffee. 250 mL daily consumption rate of energy drinks. Also an average adult body weight of 70 kg were also assumed. Estimation of the daily intakes of caffeine: Rationally, the daily intakes of caffeine through beverages consumption rely mainly on both the content levels of caffeine in the drinks and the amounts consumed of these drinks. Due to the fact that the amounts of the consumed foodstuffs depends on the food habits in 340 Pak. J. Nutr., 11 (4): 336-342, 2012 Fig. 6: Chromatogram of black tea sample (Mobile) Table 5 illustrates the estimated values of caffeine daily intakes through the consumption of the indicated foodstuff products. As expected, the data presented in this table indicates the highest caffeine intake doses through the consumption of tea followed by coffee, energy drinks in comparison to the consumption of the carbonated drinks. The mean values of caffeine daily intakes were 183 mg, 101 mg, 64 mg and 38 mg through the ingestion of tea, coffee, energy drinks and soft drinks, respectively. According to the International Food Information Council, the consumption level of caffeine for adults in the U.S. is approximately 200 mg per day (Ahmad et al., 2005). This may indicate that the contribution from beverages in the intake of caffeine is 92%, 51%, 32% and 19% for tea, coffee, energy drinks and soft drinks, respectively. REFERENCES Abdul Mumin Md., Kazi Farida Akhter, Md. Zainal Abedin, and Md. Zakir Hossain, 2006. Determination and characterization of caffeine in tea, coffee and soft drinks by solid phase extraction and high performance liquid chromatography (SPE-HPLC). Malaysian J. Chem., 8: 45-51. Ahmad Alghamdi, H., F. Ali Alghamdi and A. Abdulrahman Alwarthan, 2005. Determination of content levels of some food additives in beverages consumed in Riyadh City. J. King Saud Univ., 18: 99109. Ben Yuhas, 2002. Determination of Caffeine Content in Beverages with HPL. Chem., 384. de Azevedo, A.B.A., Paulo Mazzafera, R.S. Mohamed, S.A.B. Vieira de Melo and T.G. Kieckbusch, 2008. Extraction of caffeine, chlorogenic acids and lipids from green coffee beans using supercritical carbon dioxide and co-solvents. Braz. J. Chem. Eng., 25: 543-552. Dionex, 2007. Determination of Additives in Carbonated Beverages. Application Note 193, Dionex Corporation. G¨uzin Alpdogan, Kadir Karabina and Sidika Sungur, 2002. Derivative spectrophotometric determination of caffeine in some beverages. Turk. J. Chem., 26: 295-302. Hiroshi Ashihara, Ana Maria Monteiro, M. Fiona Gillies and Alan Crozier, 1996. Biosynthesis of caffeine in leaves of coffee. Plant Physiol., 111: 747753. Conclusion: The validated HPLC method for the quantification caffeine in beverages was found to be simple, precise, sensitive and accurate and allowed the obtaining of good results. In spite of the number of drink samples analyzed is small, the data presented in this study gave a preliminarily outline about the content levels in tea, coffee, soft and energy beverages frequently consumed in Sudan. This analytical measurement was undertaken primarily to assess the compliance of content levels of the caffeine and their daily intake doses with the permissible levels. 341 Pak. J. Nutr., 11 (4): 336-342, 2012 Komes, D., D. Horzic, A. Belscak, K. Kova cevi c Ganic and A. Baljak, 2009. Determination of caffeine content in tea and maté tea by using different methods. Czech. J. Food Sci., 27: 213-216. Lane, J.D., R.A. Adcock, R.B. Williams and C.M. Kuhn, 1990. Caffeine effects on cardiovascular and neuroendocrine responses to acute psychosocial stress and their relationship to level of habitual caffeine consumption. Psychosomatic Med., 52: 320-336. Liew Siew Ling, Nik Ismail Nik Daud and Osman Hassan, 2001. Determination of coffee content in coffee mixtures. Malaysian J. Anal. Sci., 7: 327-332. Mamina, E.A. and V.F. Pershin, 2002. Structure of chemical compounds, methods of analysis and process control HPLC determination of caffeine in biological fluids in the presence of other purine derivatives. Pharma. Chem. J., 36: 48-50. Marcia Bispo, S., C. Marcia Cristina Velosol, C. Heloísa Lucia Pinheiro, F.S. Rodolfo De Oliveira, N. Jose Oscar Reis and B. Jailson De Andrade, 2002. Simultaneous determination of caffeine, theobromine and theophylline by high-performance liquid chromatography. J. Chromatographic Sci., 40: 45-48. Michael Delaney, F., M. Kathleen Pasko, M. David Mauro, S. Diane Gsell, C. Philip Korologos, John Morawski, J. Linda Krolikowski and F. Vincent Warren Jr., 1985. Determination of aspartame, caffeine, saccharin, and benzoic acid in beverages by high performance liquid chromatography. J. Chem. Edu., 62: 618-620. Nour Violeta, I. Trandafir and Ionica Mira Elena, 2008. Quantitative determination of caffeine in carbonated beverages by an HPLC method. J. Agroalimentary Processes Technol., 14: 123-127. Tavallali, H. and M. Sheikhaei, 2009. Simultaneous kinetic determination of paracetamole and caffeine using Cu(II)-neocuproine in presence of dodecyl sulphate by H-point standard addition method. In. J. Chem., 48A: 812-816. Violeta Nour, Ion Trandafir and Mira Elena Ionica, 2010. Chromatographic determination of caffeine contents in soft and energy drinks available on the Romanian market. St. Cerc. St. CICBIA, 11: 351-358. Wanyika, H.N., E.G. Gatebe, L.M. Gitu, E.K. Ngumba and C.W. Maritim, 2010. Determination of caffeine content of tea and instant coffee brands found in the Kenyan market. Afr. J. Food Sci., 4: 353-358. 342
