Adaptive Data Distribution Management for HLA RTI
advertisement
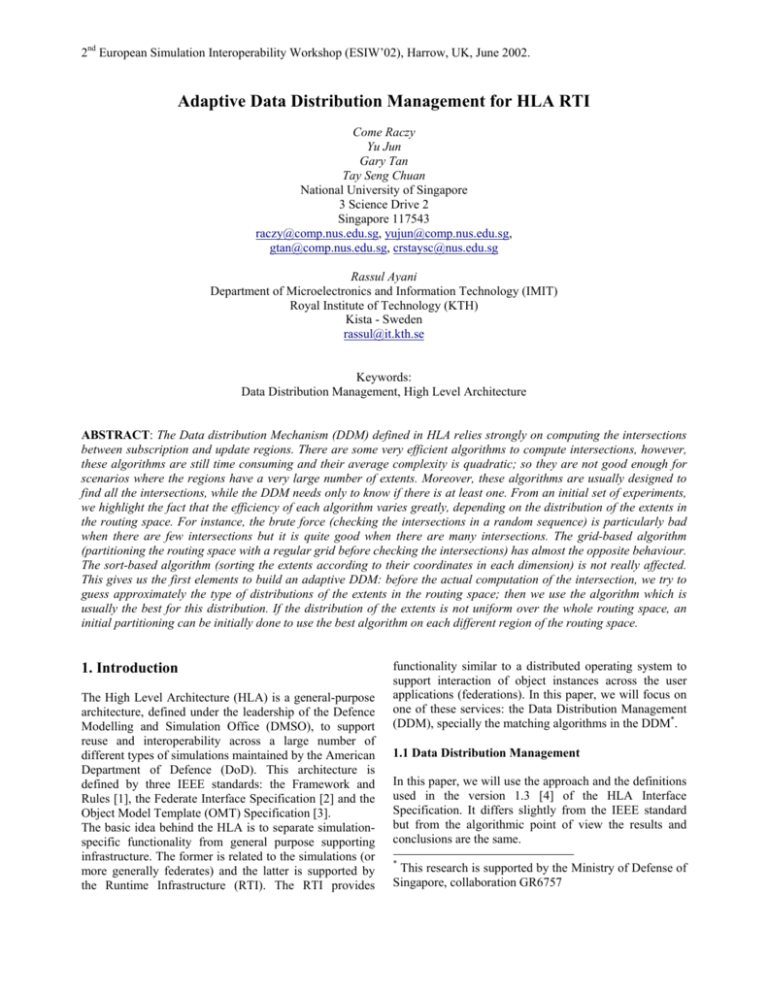
2nd European Simulation Interoperability Workshop (ESIW’02), Harrow, UK, June 2002. Adaptive Data Distribution Management for HLA RTI Come Raczy Yu Jun Gary Tan Tay Seng Chuan National University of Singapore 3 Science Drive 2 Singapore 117543 raczy@comp.nus.edu.sg, yujun@comp.nus.edu.sg, gtan@comp.nus.edu.sg, crstaysc@nus.edu.sg Rassul Ayani Department of Microelectronics and Information Technology (IMIT) Royal Institute of Technology (KTH) Kista - Sweden rassul@it.kth.se Keywords: Data Distribution Management, High Level Architecture ABSTRACT: The Data distribution Mechanism (DDM) defined in HLA relies strongly on computing the intersections between subscription and update regions. There are some very efficient algorithms to compute intersections, however, these algorithms are still time consuming and their average complexity is quadratic; so they are not good enough for scenarios where the regions have a very large number of extents. Moreover, these algorithms are usually designed to find all the intersections, while the DDM needs only to know if there is at least one. From an initial set of experiments, we highlight the fact that the efficiency of each algorithm varies greatly, depending on the distribution of the extents in the routing space. For instance, the brute force (checking the intersections in a random sequence) is particularly bad when there are few intersections but it is quite good when there are many intersections. The grid-based algorithm (partitioning the routing space with a regular grid before checking the intersections) has almost the opposite behaviour. The sort-based algorithm (sorting the extents according to their coordinates in each dimension) is not really affected. This gives us the first elements to build an adaptive DDM: before the actual computation of the intersection, we try to guess approximately the type of distributions of the extents in the routing space; then we use the algorithm which is usually the best for this distribution. If the distribution of the extents is not uniform over the whole routing space, an initial partitioning can be initially done to use the best algorithm on each different region of the routing space. 1. Introduction The High Level Architecture (HLA) is a general-purpose architecture, defined under the leadership of the Defence Modelling and Simulation Office (DMSO), to support reuse and interoperability across a large number of different types of simulations maintained by the American Department of Defence (DoD). This architecture is defined by three IEEE standards: the Framework and Rules [1], the Federate Interface Specification [2] and the Object Model Template (OMT) Specification [3]. The basic idea behind the HLA is to separate simulationspecific functionality from general purpose supporting infrastructure. The former is related to the simulations (or more generally federates) and the latter is supported by the Runtime Infrastructure (RTI). The RTI provides functionality similar to a distributed operating system to support interaction of object instances across the user applications (federations). In this paper, we will focus on one of these services: the Data Distribution Management (DDM), specially the matching algorithms in the DDM*. 1.1 Data Distribution Management In this paper, we will use the approach and the definitions used in the version 1.3 [4] of the HLA Interface Specification. It differs slightly from the IEEE standard but from the algorithmic point of view the results and conclusions are the same. * This research is supported by the Ministry of Defense of Singapore, collaboration GR6757 2nd European Simulation Interoperability Workshop (ESIW’02), Harrow, UK, June 2002. The DDM is a set of services provided by the RTI to reduce both the transmission and the reception of irrelevant data. This set of optional services allows producers of data to assert properties of their data and consumers of data to specify their data requirements. The data is distributed from the producer to the consumer when the properties match the requirements. Both the properties and the requirements are defined in terms of regions defined in the routing space associated to each data. A routing space is just the formal definition of a multi dimensional space; it is specified by its name and the name of each of its dimensions. A region is a set of extents in a routing space. An extent is just a rectangular subset defined in the routing space by its lower bound and upper bound on each dimension. For instance, a routing space representing the position of the units on the battlefield could be called "Map", with two dimensions "X" and "Y". An extent in the routing space Map would be the ranges for the dimensions X and Y: [(xmin, xmax), (ymin, ymax)]. A region would be a set of one or several of such extents. An "update region" could be for instance a region with one extent representing the position of a unit. A "subscription region" could be for instance a region with several extents, each of them representing the range of some sensors. The match between the properties and the requirements would be represented by a non-empty intersection between the update region and the subscription region. There are many other problems related to the DDM, for instance the management of the subscription groups, but in this paper, we will focus only on the matching algorithms. Map u1 u2 U s1 dimension Y S u3 s2 dimension X Figure 1 Routing space, regions and extents Figure 1 illustrates a routing space named “Map” with two dimensions “X” and “Y”. Two regions are defined in this routing space: an update region U and a subscription region S. U has three extents: u1, u2 and u3. S has two extents: s1 and s2. 1.2 Matching Problem with HLA The matching problem consists in deciding if the intersection between a subscription region S and an update region U is empty or not. This is the same as finding if there is at least one pair of extents (u, s), where u is an extent of the update region and s an extent of the subscription region, where u ∩ s ≠ ∅. Computing the intersection between two extents is quite easy because the extents have a very simple shape. The difficult part is to compute the intersection between two regions because the number of pairs to check in the worst case is the product of the cardinal of U by the cardinal of S. There are several well-known algorithms to compute such intersections but using them directly to implement the matching operation for the DDM is not very efficient. In the example given in figure 1, the matching problem would be to detect that there is an intersection between u3 and s2. An ideal algorithm should do this without checking the intersection between any other pair of extents. 1.3 Decreasing the Matching Costs As the accuracy of the simulation increases, the number of entities processed in the simulation and the number of messages between federates increase significantly. Therefore, minimizing the number of irrelevant messages becomes a priority, hence the necessity of efficient DDM services. Unfortunately, a high number of entities also means, usually, a high number of extents and the cost of the matching operation becomes a real limitation. For this reason, it is important to design solutions to reduce the matching costs when the number of extents is high. There are several aspects to consider. First, the matching algorithm doesn’t have to compute all the intersections; if the intersection between two regions is not empty, it is sufficient to find one pair of extents with a non-empty intersection. Then, the efficiency of each algorithm varies greatly depending on the distribution of the data. Finally, the optimisation of the matching operation should be done globally for the whole execution rather than independently for each intersection problem. This means that the costs must be cumulated over all the time steps and for all the regions. In this paper, we will first describe several matching algorithms and heuristics. Then we will propose some criteria to evaluate and compare them. These criteria will then be used to define an adaptive approach to select efficiently the best choice to compute the next match. 2. Matching Algorithms and Heuristics Each of the following matching algorithms will be illustrated using the example given if figure 1. 2nd European Simulation Interoperability Workshop (ESIW’02), Harrow, UK, June 2002. 2.1 Brute Force This is the most basic approach. The pairs of extents are built in a random sequence and the intersection is computed for each pair until a non-empty intersection is found. The implementation is straightforward but the complexity varies greatly with the probability to find a non-empty intersection: it’s very efficient when all update extents intersect with all subscription extent but the quadratic complexity is reached when there is no intersection at all. In the example, this algorithm would check the intersection for all these pairs of extents: (u1, s1), (u1, s2), (u2, s1), (u2, s2), (u3, s1) and (u3, s2). 2.2 Grid Partitioning The space is initially partitioned in several cells. The regions are mapped on each cell of the partition and then the intersection is computed independently on each cell, usually with the brute force approach. This approach has already been studied deeply. For instance, Cohen and Kemkes [5, 6] show the impact of the update/subscription rate on the performances of the DDM; Rak and Van Hook [7] study the influence of grid cell size on communication costs; and Berrached et al [8] compare the brute-force and the grid-based filtering. Previous work, by Zhang Yusong [9] and Gary Tan et al [10, 11] has also studied the suitability of the grid-based algorithms for the DDM. The implementation is more difficult than the brute force and it can be difficult to find the ideal number C of cells. If we assume that each extent is mapped on only one cell, and that each cell has the same number of extents, then the cost of the matching operation on each cell is divided by C2, compared to the brute force approach in the worst case. Therefore, the overall cost is divided by C if we neglect the cost of the initial partitioning. C1 u1 C3 Map C2 u2 U s1 C4 dimension Y S u3 s2 dimension X Figure 2 Partitioning the space into four cells However, if the cells are too small, compared to the size of the extents, many extents will cover several cells, hence there will be a lot of redundancy in the computation of the intersections. For instance, if the space is partitioned into four cells, as illustrated in figure 2, the algorithm only checks the intersections for the pairs of extents (u1, s1) and (u3, s2). However, as the extent s1 covers two cells, it will require twice more bookkeeping than the other extents. 2.3 Sort based Algorithm This approach, detailed in [12], computes the intersection independently on each direction. A pair of extents has a non-empty intersection if all their projection on each direction has a non-empty intersection. The upper bounds and lower bounds of each extent are sorted for each direction. When the sorted lists of points are scanned, it’s possible to maintain the set of subscription extents before the current position and the set of subscription extents after the current position. Therefore, it’s possible to know exactly, for each update extent, which subscription extents match on the given dimension. Upper bounds Lower bounds Sections u1 s1 u2 s1 u1 I u2 II III IV u3 V u3 s2 s2 VI VII VIII IX Figure 3 Sort-based algorithm on dimension X For instance, figure 3 shows the list of points representing the boundaries of the projections of the regions on the dimension X. The algorithm scans the list from left to right and performs the following actions: • Initialisation: before is empty, after contains s1 and s2; all update extents are assumed to intersect all the subscription extents. • I: the lower bound of u1 is detected; nothing is done because there is no subscription extent before. • II: the lower bound of s1 is detected; s1 is removed from after. • III: the upper bound of u1 is detected; u1 doesn’t intersect the extents remaining in after (in this case, s2). • IV: the upper bound of s1 is detected; s1 is added to before. • V: the lower bound of u2 is detected; u2 doesn’t intersect with the extents already in before (in this case s1). • VI: same as V but for u3. • VII: the lower bound of s2 is detected; s2 is removed from after. • VIII: the upper bound of u2 is detected; nothing is 2nd European Simulation Interoperability Workshop (ESIW’02), Harrow, UK, June 2002. because real problems mix all kind of difficulties that make the analysis of the results overwhelming complex. Therefore, we chose to build specific distributions of regions defined by a small set of controlled characteristics. 3.1 Characterisation of the Problems The most obvious characteristic of the problem is the number of extents. However, the efficiency of the algorithms and heuristics described in the previous part varies greatly with the distribution of the extents over the routing space and among the regions. Therefore, we have to define more accurately the simplest distributions of extents among the regions over a given routing space. We have already highlighted that an important element is the probability to get a non-empty intersection. We call this characteristic the overlapping rate, defined by: overlap rate = 2.4 Bounding Boxes 20 15 brute force 10 5 grid 10 * 10 0 Unit number 5000 There are no benchmarks to evaluate the efficiency of the matching algorithms so we have to define the experimental framework. One possibility would be to select randomly a set of real scenarios. In our opinion, this is not the best approach, first because it seems quite difficult to select a set of representative scenarios, then 25 4000 3.1 Experimental Results improved sort sort 30 3000 3. Results Analysis total area 35 2000 This heuristic takes advantage of the fact that in many simulations most things change progressively, from one time step to the next. Particularly, it is likely that most of the extents will not move so much between two time steps. Therefore, if two extents intersect one another at a given time step, there is a reasonable probability (p) that they will still intersect at the next time step. Roughly, the speedup generated by this heuristic is (1-p). 100 2.5 Temporal Coherence ∑ area of the extents Initially, to compare the algorithms, we assume that the overlapping rate is uniform over the whole area. For a given number of extents on a given area of the routing space, a small overlapping rate means that the extents are small and a large overlapping rate means that the extents are large. Another important characteristic is the number of extents in each region. This will affect significantly the brute force approach because the result needed by the DDM is the intersection between regions, not the intersection between the extents. Even though these factors are not sufficient to describe accurately real scenarios, they still seem to be the most significant characteristics for the distribution of the extents into the routing spaces. The following figures summarize some significant experimental results over a vide range of values. Time taken (seconds) This approach is not exactly a matching algorithm; it is a heuristic. The idea is to compute the bounding box of each region then to check if the intersection of the bounding boxes is empty. If it is indeed empty then there is no need to compute the intersections on the individual extents. If it is not, the matching operation can be restricted to the extents located inside the intersection of the bounding box. Even though this approach is not sufficient by itself, it is still useful because, for many problems, it allows a significant reduction of the total number of extent, at a very low cost (the complexity is linear). 1000 done because after is empty. • IX: same as VIII but for u3. This algorithm also has a quadratic complexity in the worst case because the list of subscription extents before or after the current position can contain all the extents. However, it allows some very efficient optimisations. Particularly, the set of current subscription extents can be represented by a bit vector, which dramatically reduces the cost of the matching operation for each update extend. The loop used in the brute force approach to check the intersection with all the subscription extents is replaced by two binary operations on bit vectors. On modern processors, this allows a very significant speedup. It is important to note that this algorithm computes all the intersections. It is quite difficult to organize the computation in such a way that the algorithm stops before the end because an extent at the beginning of the list for one dimension can be at the end of the list for another dimension. grid 100 * 100 Figure 4 Overlap rate = 0.01, Extent number = 1 values (overlapping rate and number of extents above 100) this algorithm is far better than the others. 50 40 improved sort 30 brute force 20 grid 10 * 10 grid 100 * 100 10 5000 4000 3000 2000 1000 0 Unit number Figure 5 Overlap rate = 1, Extent number = 1 Time taken (seconds) 1000 800 improved sort 600 sort brute force 400 As there is no straightforward solution to choose the number of cells in the partition, this shouldn’t be considered as a single algorithm but as a family of algorithms. Experiments with two different partitions, 10x10 and 100x100, confirm that the results vary greatly with the size of the cells compared to the size of the extents. When the overlapping rate is low (0.1 and below), the 100x100 grid partition is much better than the other algorithms. Unfortunately, its performances deteriorate quickly when the overlapping rate increases. The overhead of the partitioning becomes very significant when the overlapping rate reaches 1 and the 100x100 grid partition is impracticable with high overlapping rates (10 and above). The 10x10 grid partition is far less sensitive to the overlapping rate and gives an acceptable computation time for a wide range of values. grid 10 * 10 grid 100 * 100 3.4 Sort-based Algorithm 200 5000 4000 3000 2000 1000 100 0 Unit number Figure 6 Overlap rate = 100, Extent number = 1 400 300 improved sort sort 200 The most interesting characteristic of the sort-based algorithm is that its performances don’t vary greatly with the overlapping rate and the number of extents in the regions. In addition, it has the best performances, compared to the other algorithms, when the overlapping rate is not too low (1 and above) and when the regions have a low number of extents (less than 50). For lower overlapping rates, it is outperformed by the 100x100 gridpartitioning algorithm. For the high overlapping rates, it is outperformed by the brute force when the regions have a large number of extents. 4. Adaptive Approach brute force grid 10 * 10 grid 100 * 100 100 5000 4000 3000 2000 1000 0 100 Time taken (seconds) 3.3 Grid Partitioning sort 100 Time taken (seconds) 2nd European Simulation Interoperability Workshop (ESIW’02), Harrow, UK, June 2002. Unit number Figure 7 Overlap rate = 100, Extent number = 50 3.2 Brute Force As expected from the initial analysis of the algorithm, the brute force is impracticable except for high overlapping rates (10 and over). In this case, it can even perform very well if the regions have many extents. For the extreme The results given in the previous part highlight that the choice of the algorithm should take into account the characteristics of the problem; at least the overlapping rate and maybe the number of extents in the regions. Both of these characteristics are dynamic values; they can even vary greatly during the simulation and at a given time step they can vary greatly over the routing space. For instance the update regions, when they represent groups of units, will have different distributions on the battlefield, depending on their actions and not all the units are necessarily in reach of the subscription regions of the adverse units. In this part, we propose a simple and efficient algorithm to compute and keep track of these important characteristics during the simulation process. 2nd European Simulation Interoperability Workshop (ESIW’02), Harrow, UK, June 2002. 4.1 Characterisation of the problems As we are in the case of a high number of extents, it is not realistic to use the average overlapping rate on the whole area. In the real cases, there will probably be some areas of the routing space with a high overlapping rate, regions with a medium overlapping rate and regions with a low overlapping rate. As it was highlighted earlier in this paper, different algorithms should be used in these different areas, so it is important to identify them. There are two easy ways to do so. The first one is to make a partition of the space and to compute the local overlapping rate on each cell. Even though this approach is simple, and usually a significant improvement compared to the global evaluation of the overlapping rate, it depends greatly on the number of cells of the partition. There are some ways to get round this problem, for instance with a hierarchical partitioning approach: the initial partition has a few cells and each cell is partitioned again, until, either a high overlapping rate is detected, or the number of extents in the cell is below a given threshold. The second solution is to apply the sort-based approach to create the partition. Once the boundaries of the extents are sorted for each dimension, scanning the lists of points gives directly the number of extents in each section. In addition, it is also possible to compute the average overlapping rate for each section. Doing this for all dimensions of the routing space already gives a good idea about the distribution of the extents over the space. Particularly this approach is sufficient to know if the extents are uniformly distributed over the space or if there are depleted areas and areas with a significant accumulation of extents. In addition, it is also easy to keep track of the number of regions actually represented in each section during this process. 4.2 Algorithm Selection Initially, when nothing is known about the characteristics of the problem, the best solution seems to select the sortbased algorithm. The first reason is its efficiency: it is better than the other algorithms for a wide range of situations and even when it is not, it is not too bad. The second reason is that the analysis of the problem can be performed at a very low cost in addition to the matching operation. For the later time steps, of course it is recommended to keep track of the previous matches, just in case that they would still be valid for several successive time steps. The bounding box approach can also be used systematically because its cost is still very low. However, we still need a mechanism to optimise the choice of the algorithm for the different areas of the routing space. The mechanism described previously to identify roughly the distribution of the extents provides the solution. The grid-based algorithm, with a large number of cells, should be used on the depleted areas (overlapping rate of 0.01 and lower). The brute force should be used on the areas with an accumulation of extents (overlapping rate of 50 and above) belonging to a small number of different regions. The sort-based algorithm should be used in all the other cases. The problem is to update the characteristics of the problem when the extents move. A solution is to keep the same partition as long as it is coherent. This means that the average overlapping rate of each cell can easily be updated when the extents are modified. When this average rate goes beyond the threshold in a cell then the whole partition should be computed again. It is important to notice that the range of values for the overlapping rate is so wide that the selection of the algorithm doesn’t need to rely on accurate values. A very rough analysis is good enough to make an appropriate selection of the best algorithm in most cases. Of course, when the value of the overlapping rate is close to one of the threshold, choosing the wrong algorithm will not have a significant impact on the performances (the two algorithms will have approximately the same behavior). 5. Conclusions and Perspectives The Data Distribution Management, even though it is an optional service in HLA becomes a necessity when the simulations increase in complexity. In this case, the matching operation can become one of the main limitations in the simulations. For this reason it is important to provide efficient mechanisms to solve this problem. There are several algorithms and heuristics available for this specific aspect, however the experimental results highlight that their relative efficiency varies greatly with the characteristics of the problem. Hence, rather than relying upon a unique algorithm it is a better choice to have different algorithm available and to select the most appropriate. The drawback of this approach is that the selection of the algorithm requires an initial analysis of the characteristics of the problem. This analysis is costly so a trade off between the cost and the accuracy must be done. In this paper, we provide a comparison between several algorithms and some of the elements that have an influence over their performances. In addition, we provide some guidelines for the dynamic selection of the most appropriate algorithm. Several aspects are not yet quantified so the selection of the algorithm is still far from optimum. However, before going further in this aspect of the study, we need to refine the definition of an appropriate set of benchmarks to get values that are more realistic. 2nd European Simulation Interoperability Workshop (ESIW’02), Harrow, UK, June 2002. 6. References [1] IEEE Standard No.1516-2000, “IEEE Standard for Modeling and Simulation (M&S) High Level Architecture (HLA) - Framework and Rules” [2] IEEE Standard No 1516.1-2000, “IEEE Standard for Modeling and Simulation (M&S) High Level Architecture (HLA) Federate Interface Specification” [3] IEEE Standard No 1516.2-2000 “IEEE Standard for Modeling and Simulation (M&S) High Level Architecture (HLA) - Object Model Template (OMT) Specification” [4] US Department of Defense, “High Level Architecture Interface Specification”, Version 1.3, 2 April 1998 [5] Danny Cohen and Andreas Kemkes, “User-Level Measurement of DDM Scenarios”, in Proceedings of the Simulation Interoperability Workshop, Spring 1997 [6] Danny Cohen and Andreas Kemkes, “Applying user-level measurements to RTI 1.3 release 2”, in Proceedings of the Simulation Interoprability Workshop, Fall 1998 [5] Judith S. Dahmann, Richard M. Fujimoto and Richard M. Weatherly, “The Department of Defense High Level Architecture”, In proceedings of Winter Simulation Conference 1997. [6] Gary Tan, Rassul Ayani, YuSong Zhang and Farshad Moradi, “Grid-based Data Management in Distributed Simulation”, in proceedings of 33rd Annual Simulation Symposium, Washington, U.S.A., April 2000. [7] Steven J. Rak and Daniel J. Van Hook, “Evaluation of grid-based relevance filtering for multicast group assignment”, in Proceedings of the Distributed Interactive Simulation, 1996 [8] A. Berrached, M. Beheshti and O. Sirisaengtaksin, “Evaluation of Grid-Based data distribution in the HLA”, in the Proceedings of the 1998 Conference on Simulation Methods and Applications, Orlando FL [9] Zhang Yusong, “A Simulation Platform for Investigating Data Filtering in Data Distribution Management”, thesis submitted for the M.Sc degree in School of Computing, National University of Singapore, Feb 2000 [10] Gary Tan, Liang Xu, Farshad Moradi and Yusong Zhang, “An Agent-based DDM Filtering Mechanism”, in proceedings of MASCOTS, San Francisco CA, USA, Aug 2000. [11] Gary Tan, YuSong Zhang and Rassul Ayani, “A Hybrid Approach to Data Distribution Management”. [12] Yu Jun, Come Raczy and Gary Tan, “Evaluation of Sort-based Matching Algorithm for the DDM”, in the Proceedings of the 16th Workshop on Parallel and Distributed Simulation, Washington, USA, May 2002

