Indicative Income Tables
advertisement
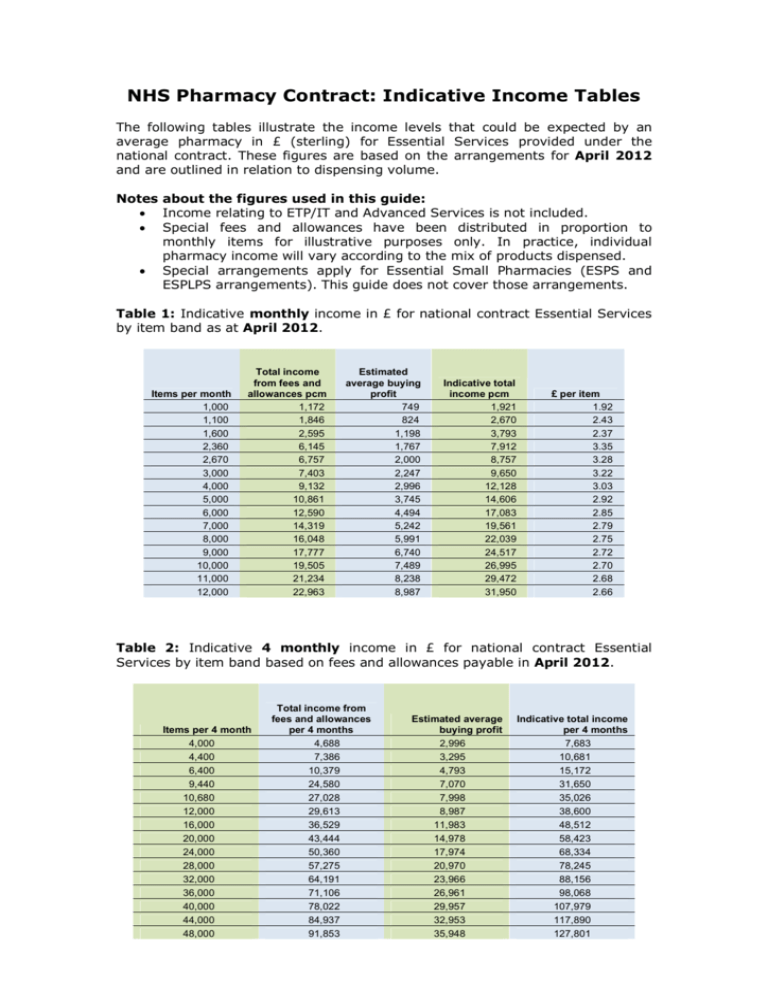
NHS Pharmacy Contract: Indicative Income Tables The following tables illustrate the income levels that could be expected by an average pharmacy in £ (sterling) for Essential Services provided under the national contract. These figures are based on the arrangements for April 2012 and are outlined in relation to dispensing volume. Notes about the figures used in this guide: Income relating to ETP/IT and Advanced Services is not included. Special fees and allowances have been distributed in proportion to monthly items for illustrative purposes only. In practice, individual pharmacy income will vary according to the mix of products dispensed. Special arrangements apply for Essential Small Pharmacies (ESPS and ESPLPS arrangements). This guide does not cover those arrangements. Table 1: Indicative monthly income in £ for national contract Essential Services by item band as at April 2012. Items per month 1,000 1,100 1,600 2,360 2,670 3,000 4,000 5,000 6,000 7,000 8,000 9,000 10,000 11,000 12,000 Total income from fees and allowances pcm 1,172 1,846 2,595 6,145 6,757 7,403 9,132 10,861 12,590 14,319 16,048 17,777 19,505 21,234 22,963 Estimated average buying profit 749 824 1,198 1,767 2,000 2,247 2,996 3,745 4,494 5,242 5,991 6,740 7,489 8,238 8,987 Indicative total income pcm 1,921 2,670 3,793 7,912 8,757 9,650 12,128 14,606 17,083 19,561 22,039 24,517 26,995 29,472 31,950 £ per item 1.92 2.43 2.37 3.35 3.28 3.22 3.03 2.92 2.85 2.79 2.75 2.72 2.70 2.68 2.66 Table 2: Indicative 4 monthly income in £ for national contract Essential Services by item band based on fees and allowances payable in April 2012. Items per 4 month 4,000 4,400 6,400 9,440 10,680 12,000 16,000 20,000 24,000 28,000 32,000 36,000 40,000 44,000 48,000 Total income from fees and allowances per 4 months 4,688 7,386 10,379 24,580 27,028 29,613 36,529 43,444 50,360 57,275 64,191 71,106 78,022 84,937 91,853 Estimated average buying profit 2,996 3,295 4,793 7,070 7,998 8,987 11,983 14,978 17,974 20,970 23,966 26,961 29,957 32,953 35,948 Indicative total income per 4 months 7,683 10,681 15,172 31,650 35,026 38,600 48,512 58,423 68,334 78,245 88,156 98,068 107,979 117,890 127,801 Table 3: Indicative monthly income in £ from fees and allowances for Essential Services by item band as at April 2012. Items per month 1,000 1,100 1,600 2,360 2,670 3,000 4,000 5,000 6,000 7,000 8,000 9,000 10,000 11,000 12,000 Item fee 900 990 1,440 2,124 2,403 2,700 3,600 4,500 5,400 6,300 7,200 8,100 9,000 9,900 10,800 Establishment payment 1,940 2,016 2,092 2,092 2,092 2,092 2,092 2,092 2,092 2,092 2,092 2,092 Special fees and allowances 97 107 155 229 259 291 388 484 581 678 775 872 969 1,066 1,163 Repeat dispensing set up fee 125 125 125 125 125 125 125 125 125 125 125 125 125 125 125 Practice payments (including contribution for DDA) 50 625 875 1,728 1,954 2,196 2,928 3,660 4,392 5,124 5,856 6,588 7,320 8,052 8,784 Total income from fees and allowances pcm 1,172 1,846 2,595 6,145 6,757 7,403 9,132 10,861 12,590 14,319 16,048 17,777 19,505 21,234 22,963 £ per item 1.17 1.68 1.62 2.60 2.53 2.47 2.28 2.17 2.10 2.05 2.01 1.98 1.95 1.93 1.91 Table 4: Indicative 4 monthly income in £ from fees and allowances for Essential Services by item band as at April 2012. Items per 4 month 4,000 4,400 6,400 9,440 10,680 12,000 16,000 20,000 24,000 28,000 32,000 36,000 40,000 44,000 48,000 Item fee 3,600 3,960 5,760 8,496 9,612 10,800 14,400 18,000 21,600 25,200 28,800 32,400 36,000 39,600 43,200 Establishment payment 7,759 8,063 8,367 8,367 8,367 8,367 8,367 8,367 8,367 8,367 8,367 8,367 Special fees and allowances 388 426 620 915 1,035 1,163 1,550 1,938 2,325 2,713 3,100 3,488 3,875 4,263 4,650 Repeat dispensing set up fee 500 500 500 500 500 500 500 500 500 500 500 500 500 500 500 Practice payments 200 2,499 3,499 6,910 7,818 8,784 11,712 14,640 17,568 20,496 23,424 26,352 29,280 32,208 35,136 Total income from fees and allowances for 4 months 4,688 7,386 10,379 24,580 27,028 29,613 36,529 43,444 50,360 57,275 64,191 71,106 78,022 84,937 91,853 £ per item 1.17 1.68 1.62 2.60 2.53 2.47 2.28 2.17 2.10 2.05 2.01 1.98 1.95 1.93 1.91 Illustration of monthly income from fees and allowances for new contract Essential Services for an average pharmacy dispensing 3,000 items as at April 2012 Income component Item fee Establishment payment Special fees and allowances Repeat dispensing set up fee Practice payments Total income from fees and allowances pcm Expected average income pcm in £ 2,700 2,092 291 125 2,196 Calculation basis 3,000 items at standard 90p per item Monthly equivalent of maximum annual total of £25,100 3,000 items at average 9.69 ppi Monthly equivalent of £1,500 annual set up fee 3,000 items at standard 73.2p per item 7,403 Illustration of monthly income from fees and allowances for new contract Essential Services for an average pharmacy dispensing 5,000 items as at April 2012 Income component Item fee Establishment payment Special fees and allowances Repeat dispensing set up fee Practice payments Total income from fees and allowances pcm Expected average income pcm in £ 4,500 2,092 484 125 3,660 Calculation basis 5,000 items at standard 90p per item Monthly equivalent of maximum annual total of £25,100 5,000 items at average 9.69 ppi Monthly equivalent of £1,500 annual set up fee 5,000 items at standard 73.2p per item 10,861 Illustration of monthly income from fees and allowances for new contract Essential Services for an average pharmacy dispensing 8,000 items as at April 2012 Income component Item fee Establishment payment Special fees and allowances Repeat dispensing set up fee Practice payments Total income from fees and allowances pcm Expected average income pcm in £ 7,200 2,092 775 125 5,856 Calculation basis 8,000 items at standard 90p per item Monthly equivalent of maximum annual total of £25,100 8,000 items at average 9.69 ppi Monthly equivalent of £1,500 annual set up fee 8,000 items at standard 73.2p per item 16,048 For support, please contact the PSNC Information Team (info@psnc.org.uk / 0844 381 4180)
