Price Indicators
advertisement
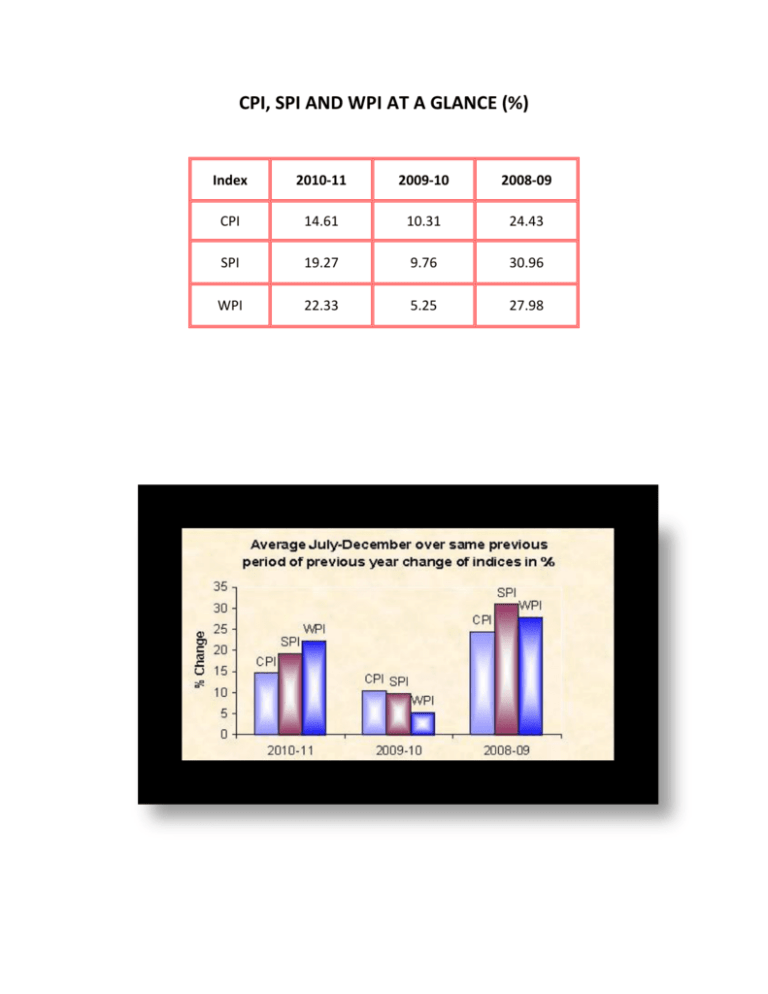
CPI, SPI AND WPI AT A GLANCE (%) Index 2010-11 2009-10 2008-09 CPI 14.61 10.31 24.43 SPI 19.27 9.76 30.96 WPI 22.33 5.25 27.98 CONSUMER PRICE INDEX Consumer Price Index by Group of Commodities and Services (%) Group General Food & beverages Non-perishable food items Perishable food items Apparel, textile & footwear House rent Fuel & lighting Household, furniture & equipment etc. Transport & communication Recreation & entertainment Education Cleaning, laundry & personal appearance Medicare INCOME GROUP Indices Change December, 2010 over … Nov-10 Dec-09 Nov-10 Dec-09 … in percentage … in % points (impact) -0.51 15.46 -0.51 15.46 -1.90 20.36 -1.27 8.47 0.28 17.12 0.22 6.18 -12.94 43.52 -1.49 2.29 0.99 11.91 0.10 0.75 0.65 6.67 0.25 1.61 1.75 22.50 0.21 1.69 Group Weigh t in % Dec-10 Nov-10 Dec-09 100.00 40.34 35.20 5.14 6.10 23.43 7.29 243.60 286.64 280.45 329.04 179.84 219.32 263.60 244.84 292.20 279.68 377.93 178.08 217.91 259.06 210.99 238.16 239.46 229.27 160.70 205.61 215.18 3.29 185.96 184.47 169.01 0.81 10.03 0.04 0.34 7.32 229.20 228.79 197.26 0.18 16.19 0.02 1.22 0.83 139.56 139.45 122.62 0.08 13.82 0.00 0.12 3.45 194.79 194.75 185.19 0.02 5.18 0.00 0.18 5.88 201.77 200.02 181.14 0.87 11.39 0.08 0.69 2.07 181.45 178.98 153.98 1.38 17.84 %change December 2010 over … 0.05 0.38 Average of month Group impact on the change of December 2010 over December 2009 in percentage points Food & beverages Non-perishable food items Perishable food items Apparel, textile & footwear House rent Fuel & lighting Household, furniture & equipment etc. Transport & communication Recreation & entertainment Education Cleaning, laundry & personal appearance Medicare SENSITIVE PRICE INDICATOR Sensitive Price Indicator (%) G1 Lowest G2 Lowest but one G3 Highest but one G4 Highest COMBINED %change December 2010 over … Average of month INCOME GROUP Dec. 10 Nov. 10 Dec. 09 Nov. 10 Dec. 09 298.53 294.87 290.30 279.19 282.83 300.46 296.90 291.97 279.89 284.33 245.4 242.66 238.85 230.46 232.81 -0.64 -0.68 -0.57 -0.25 -0.53 21.65 21.52 21.54 21.14 21.49 December, 2010 over December, 2009 per Income Group WHOLESALE PRICE INDEX Wholesale Price Index by Commodity Group (%) Group General Food Raw Materials Fuel, lighting & lubricants Manufactures Building Materials Group Weight in % Indice s Dec, 10 Nov. 10 Dec. 09 Change December 2010 over … Nov. 10 Dec. 09 Nov. 10 Dec. 09 … in percentage … in % points (impact) 1.06 25.72 1.06 25.72 -1.53 21.70 -0.61 8.80 8.45 70.84 0.64 5.45 100.00 42.12 7.99 278.38 286.07 386.42 275.46 290.52 356.3 221.43 235.06 226.19 19.29 335.15 332.06 290.11 0.93 15.53 0.17 2.88 25.87 4.73 200.05 224.13 193.44 222.7 152.91 186.76 3.42 0.64 30.83 20.01 0.83 0.03 7.68 0.91 WPI-group impact on the change December 2010 over December 2009 in percentage points (in total: 25.72) 0
