155S6.5_3 The Central Limit Theorem
advertisement
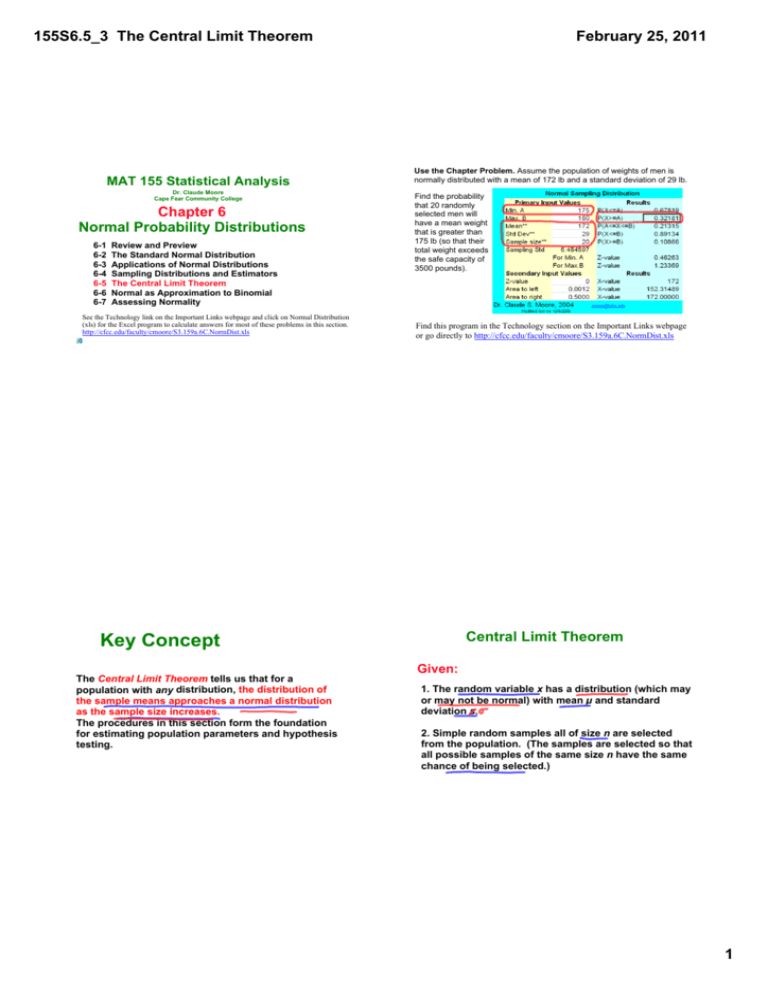
155S6.5_3 The Central Limit Theorem MAT 155 Statistical Analysis Dr. Claude Moore Cape Fear Community College Chapter 6 Normal Probability Distributions 6­1 Review and Preview 6­2 The Standard Normal Distribution 6­3 Applications of Normal Distributions 6­4 Sampling Distributions and Estimators 6­5 The Central Limit Theorem 6­6 Normal as Approximation to Binomial 6­7 Assessing Normality See the Technology link on the Important Links webpage and click on Normal Distribution (xls) for the Excel program to calculate answers for most of these problems in this section. http://cfcc.edu/faculty/cmoore/S3.159a.6C.NormDist.xls February 25, 2011 Use the Chapter Problem. Assume the population of weights of men is normally distributed with a mean of 172 lb and a standard deviation of 29 lb. Find the probability that 20 randomly selected men will have a mean weight that is greater than 175 lb (so that their total weight exceeds the safe capacity of 3500 pounds). Find this program in the Technology section on the Important Links webpage or go directly to http://cfcc.edu/faculty/cmoore/S3.159a.6C.NormDist.xls Central Limit Theorem Key Concept The Central Limit Theorem tells us that for a population with any distribution, the distribution of the sample means approaches a normal distribution as the sample size increases. The procedures in this section form the foundation for estimating population parameters and hypothesis testing. Given: 1. The random variable x has a distribution (which may or may not be normal) with mean µ and standard deviation s. 2. Simple random samples all of size n are selected from the population. (The samples are selected so that all possible samples of the same size n have the same chance of being selected.) 1 155S6.5_3 The Central Limit Theorem Central Limit Theorem – Conclusions: 1. The distribution of sample x will, as the sample size increases, approach a normal distribution. 2. The mean of the sample means is the population mean µ. 3. The standard deviation of all sample means is February 25, 2011 Practical Rules Commonly Used 1. For samples of size n larger than 30, the distribution of the sample means can be approximated reasonably well by a normal distribution. The approximation gets closer to a normal distribution as the sample size n becomes larger. 2. If the original population is normally distributed, then for any sample size n, the sample means will be normally distributed (not just the values of n larger than 30). Notation the mean of the sample means the standard deviation of sample mean Example ­ Normal Distribution As we proceed from n = 1 to n = 50, we see that the distribution of sample means is approaching the shape of a normal distribution. (often called the standard error of the mean) 2 155S6.5_3 The Central Limit Theorem Example ­ Uniform Distribution As we proceed from n = 1 to n = 50, we see that the distribution of sample means is approaching the shape of a normal distribution. Important Point As the sample size increases, the sampling distribution of sample means approaches a normal distribution. February 25, 2011 Example ­ U­Shaped Distribution As we proceed from n = 1 to n = 50, we see that the distribution of sample means is approaching the shape of a normal distribution. Example – Water Taxi Safety Use the Chapter Problem. Assume the population of weights of men is normally distributed with a mean of 172 lb and a standard deviation of 29 lb. Find the probability that if an individual man is randomly selected, his weight is greater than 175 lb. Find the probability that 20 randomly selected men will have a mean weight that is greater than 175 lb (so that their total weight exceeds the safe capacity of 3500 pounds). 3 155S6.5_3 The Central Limit Theorem Example – cont a) Find the probability that if an individual man is randomly selected, his weight is greater than 175 lb. Example ­ cont a) Find the probability that if an individual man is randomly selected, his weight is greater than 175 lb. P(x > 175) = 0.4602 b) Find the probability that 20 randomly selected men will have a mean weight that is greater than 175 lb (so that their total weight exceeds the safe capacity of 3500 pounds). February 25, 2011 Example – cont b) Find the probability that 20 randomly selected men will have a mean weight that is greater than 175 lb (so that their total weight exceeds the safe capacity of 3500 pounds). Interpretation of Results Given that the safe capacity of the water taxi is 3500 pounds, there is a fairly good chance (with probability 0.3228) that it will be overloaded with 20 randomly selected men. It is much easier for an individual to deviate from the mean than it is for a group of 20 to deviate from the mean. 4 155S6.5_3 The Central Limit Theorem Correction for a Finite Population When sampling without replacement and the sample size n is greater than 5% of the finite population of size N (that is, n > 0.05N ), adjust the standard deviation of sample means by multiplying it by the finite population correction factor: February 25, 2011 Recap In this section we have discussed: • Central limit theorem. • Practical rules. • Effects of sample sizes. • Correction for a finite population. Using the Central Limit Theorem. In Exercises 5– 8, assume that SAT scores are normally distributed with mean μ = 1518 and standard deviation σ = 325 ( based on data from the College Board). Using the Central Limit Theorem. In Exercises 5– 8, assume that SAT scores are normally distributed with mean μ = 1518 and standard deviation σ = 325 ( based on data from the College Board). 302/6. a. If 1 SAT score is randomly selected, find the probability that it is greater than 1600. b. If 64 SAT scores are randomly selected, find the probability that they have a mean greater than 1600. 302/8. a. If 1 SAT score is randomly selected, find the probability that it is between 1440 and 1480. b. If 16 SAT scores are randomly selected, find the probability that they have a mean between 1440 and 1480. c. Why can the central limit theorem be used in part (b), even though the sample size does not exceed 30? = normalcdf(1440, 1480, 1518, 325) = 0.0483 (b) P(1440 ≤ mean ≤ 1480) = normalcdf(1440, 1480, 1518, 325/√16) = 0.1515 (c) We can use the Central Limit Theorem with sample size 16 < 30 because the original data is normally distributed. See page 294 in textbook: "If the original population is normally distributed, then for any same size n, the sample means will normally distributed." 5 155S6.5_3 The Central Limit Theorem 302/10. Mensa Membership in Mensa requires an IQ score above 131.5. Nine candidates take IQ tests, and their summary results indicated that their mean IQ score is 133. (IQ scores are normally distributed with a mean of 100 and a standard deviation of 15.) a. If 1 person is randomly selected from the general population, find the probability of getting someone with an IQ score of at least 133. b. If 9 people are randomly selected, find the probability that their mean IQ score is at least 133. c. Although the summary results are available, the individual IQ test scores have been lost. Can it be concluded that all 9 candidates have IQ scores above 131.5 so that they are all eligible for Mensa membership? 303/14. Designing Motorcycle Helmets Engineers must consider the breadths of male heads when designing motorcycle helmets. Men have head breadths that are normally distributed with a mean of 6.0 in. and a standard deviation of 1.0 in. (based on anthropometric survey data from Gordon, Churchill, et al.). a. If one male is randomly selected, find the probability that his head breadth is less than 6.2 in. b. The Safeguard Helmet company plans an initial production run of 100 helmets. Find the probability that 100 randomly selected men have a mean head breadth less than 6.2 in. c. The production manager sees the result from part (b) and reasons that all helmets should be made for men with head breadths less than 6.2 in., because they would fit all but a few men. What is wrong with that reasoning? February 25, 2011 303/12. Effect of Diet on Length of Pregnancy The lengths of pregnancies are normally distributed with a mean of 268 days and a standard deviation of 15 days. a. If 1 pregnant woman is randomly selected, find the probability that her length of pregnancy is less than 260 days. b. If 25 randomly selected women are put on a special diet just before they become pregnant, find the probability that their lengths of pregnancy have a mean that is less than 260 days (assuming that the diet has no effect). c. If the 25 women do have a mean of less than 260 days, does it appear that the diet has an effect on the length of pregnancy, and should the medical supervisors be concerned? 303/16. Labeling of M& M Packages M& M plain candies have a mean weight of 0.8565 g and a standard deviation of 0.0518 g (based on Data Set 18 in Appendix B). The M& M candies used in Data Set 18 came from a package containing 465 candies, and the package label stated that the net weight is 396.9 g. (If every package has 465 candies, the mean weight of the candies must exceed 396.9/465 = 0.8535 g for the net contents to weigh at least 396.9 g.) a. If 1 M& M plain candy is randomly selected, find the probability that it weighs more than 0.8535 g. b. If 465 M& M plain candies are randomly selected, find the probability that their mean weight is at least 0.8535 g. c. Given these results, does it seem that the Mars Company is providing M& M consumers with the amount claimed on the label? 6 155S6.5_3 The Central Limit Theorem 304/18. Vending Machines Currently, quarters have weights that are normally distributed with a mean of 5.670 g and a standard deviation of 0.062 g. A vending machine is configured to accept only those quarters with weights between 5.550 g and 5.790 g. a. If 280 different quarters are inserted into the vending machine, what is the expected number of rejected quarters? b. If 280 different quarters are inserted into the vending machine, what is the probability that the mean falls between the limits of 5.550 g and 5.790 g? c. If you own the vending machine, which result would concern you more? The result from part (a) or the result from part (b)? Why? February 25, 2011 304/20. Body Temperatures Assume that the population of human body temperatures has a mean of 98.6° F, as is commonly believed. Also assume that the population standard deviation is 0.62° F ( based on data from University of Maryland researchers). If a sample of size n = 106 is randomly selected, find the probability of getting a mean temperature of 98.2° F or lower. ( The value of 98.2° F was actually obtained; see the midnight temperatures for Day 2 in Data Set 2 of Appendix B.) Does that probability suggest that the mean body temperature is not 98.6° F? After further consideration, I changed the "no" to "yes" on this answer. 7
