The Moving Man Lab
advertisement
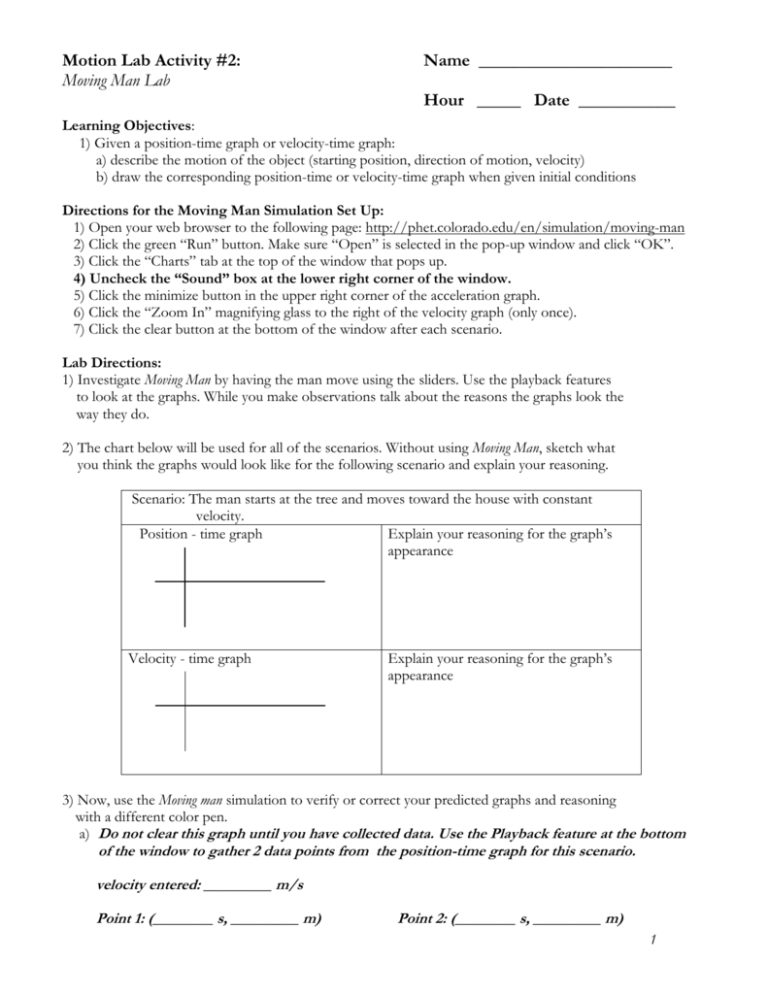
Motion Lab Activity #2: Moving Man Lab Name ______________________ Hour _____ Date ___________ Learning Objectives: 1) Given a position-time graph or velocity-time graph: a) describe the motion of the object (starting position, direction of motion, velocity) b) draw the corresponding position-time or velocity-time graph when given initial conditions Directions for the Moving Man Simulation Set Up: 1) Open your web browser to the following page: http://phet.colorado.edu/en/simulation/moving-man 2) Click the green “Run” button. Make sure “Open” is selected in the pop-up window and click “OK”. 3) Click the “Charts” tab at the top of the window that pops up. 4) Uncheck the “Sound” box at the lower right corner of the window. 5) Click the minimize button in the upper right corner of the acceleration graph. 6) Click the “Zoom In” magnifying glass to the right of the velocity graph (only once). 7) Click the clear button at the bottom of the window after each scenario. Lab Directions: 1) Investigate Moving Man by having the man move using the sliders. Use the playback features to look at the graphs. While you make observations talk about the reasons the graphs look the way they do. 2) The chart below will be used for all of the scenarios. Without using Moving Man, sketch what you think the graphs would look like for the following scenario and explain your reasoning. Scenario: The man starts at the tree and moves toward the house with constant velocity. Position - time graph Explain your reasoning for the graph’s appearance Velocity - time graph Explain your reasoning for the graph’s appearance 3) Now, use the Moving man simulation to verify or correct your predicted graphs and reasoning with a different color pen. a) Do not clear this graph until you have collected data. Use the Playback feature at the bottom of the window to gather 2 data points from the position-time graph for this scenario. velocity entered: _________ m/s Point 1: (________ s, _________ m) Point 2: (________ s, _________ m) 1 b) Look at your graphs, reasonings and the corrections from questions 2 and 3. Talk about why some of your predictions were wrong and how your ideas about motion have changed. c) Find the slope of the position-time graph from scenario # 3). Show your work. Compare the slope to the velocity you entered for this scenario. d) Examine the following equation for velocity: Reflect on your prior experiences in your math classes. How does this equation validate your answer to part c)? 4) Make new charts for of the following scenarios (already done for you on the following pages). Predict what you think the graphs will look like, and then use Moving man to verify or correct your predicted graphs and reasoning with a different color pen. a) The man starts three meters from the house and moves towards the tree quickly. b) The man starts at the house and moves towards the tree slowly. c) The man stands still while he talks on his cell phone near the left-most brick wall, then walks toward the house at a constant rate trying to get better cell reception. He comes to a sudden stop when the coverage is good (about a meter before the house) and stands still to finish his conversation. d) The man starts close to the house, stands still for a little while, then walks toward the tree at a constant rate for a while, once he reaches the midpoint (0m) he walks quickly the rest of the distance to the tree and stops once he reaches the brick wall. 4a) Scenario: The man starts three meters from the house and moves towards the tree quickly. Position - time graph Explain your reasoning for the graph’s appearance Velocity - time graph Explain your reasoning for the graph’s appearance 2 4b) Scenario The man starts at the house and moves towards the tree slowly. Position - time graph Velocity - time graph Explain your reasoning for the graph’s appearance Explain your reasoning for the graph’s appearance 4c) Scenario: The man stands still while he talks on his cell phone near the left-most brick wall, then walks toward the house at a constant rate trying to get better cell reception. He comes to a sudden stop when the coverage is good (about a meter before the house) and stands still to finish his conversation. Position - time graph Velocity - time graph Explain your reasoning for the graph’s appearance Explain your reasoning for the graph’s appearance 3 4d) Scenario: The man starts close to the house, stands still for a little while, then walks toward the tree at a constant rate for a while, once he reaches the midpoint (0m) he walks quickly the rest of the distance to the tree and stops once he reaches the brick wall. Position - time graph Explain your reasoning for the graph’s appearance Velocity - time graph Explain your reasoning for the graph’s appearance 5) Sketch the position and velocity graphs for the following scenario: A man wakes up from his nap under the tree then walks quickly toward the house. He stops because he is worried that he dropped his keys. He stands still as he searches his pockets for his keys. Once he finds them, he continues calmly to walk toward the house and then stops when he is at the door. Scenario: A man wakes up from his nap under the tree then walks quickly toward the house. He stops because he is worried that he dropped his keys. He stands still as he searches his pockets for his keys. Once he finds them, he continues calmly to walk toward the house and then stops when he is at the door. Position - time graph Velocity - time graph Explain your reasoning for the graph’s appearance Explain your reasoning for the graph’s appearance 4 6) With your lab partners, write a motion scenario that you could test. Test it, and then write a description of how you used the program to generate the graphs. Sketch the graphs. Your scenario should contain these three elements (order is not important) a) slow and fast parts to the trip b) two directions changes during the trip c) one section where the person is stopped for at least 2 seconds during the trip 6) Your scenario: Position - time graph Velocity - time graph x Explain your reasoning for the graph’s appearance Explain your reasoning for the graph’s appearance 7) Individually write a possible scenario for the following graph. Then compare your scenario with your lab partners to check if it’s reasonable. Position vs. Time t 5 8) Examine the displacement-time graph shown below. Write a statement describing what is happening for the each part of the graph. Be sure to include the direction of motion and velocity. Position vs. Time x t Part A B C D E F Description of direction and speed Moving forward at a constant velocity of ~1 m/s. Not moving (velocity = 0 m/s). 9) Is it possible for a person to reproduce these exact graphs by walking? Explain your answer and describe what the position-time graph would actually look like. Think about how people move as they take each step. 10) Examine your answers to analysis questions 3c) and 3d). What do you think the displacement-time graph would look like if the velocity increased at a constant rate? Describe the shape of the graph and create a sketch below. 6
