Measured and self-reported body weight and stature in Emergency
advertisement
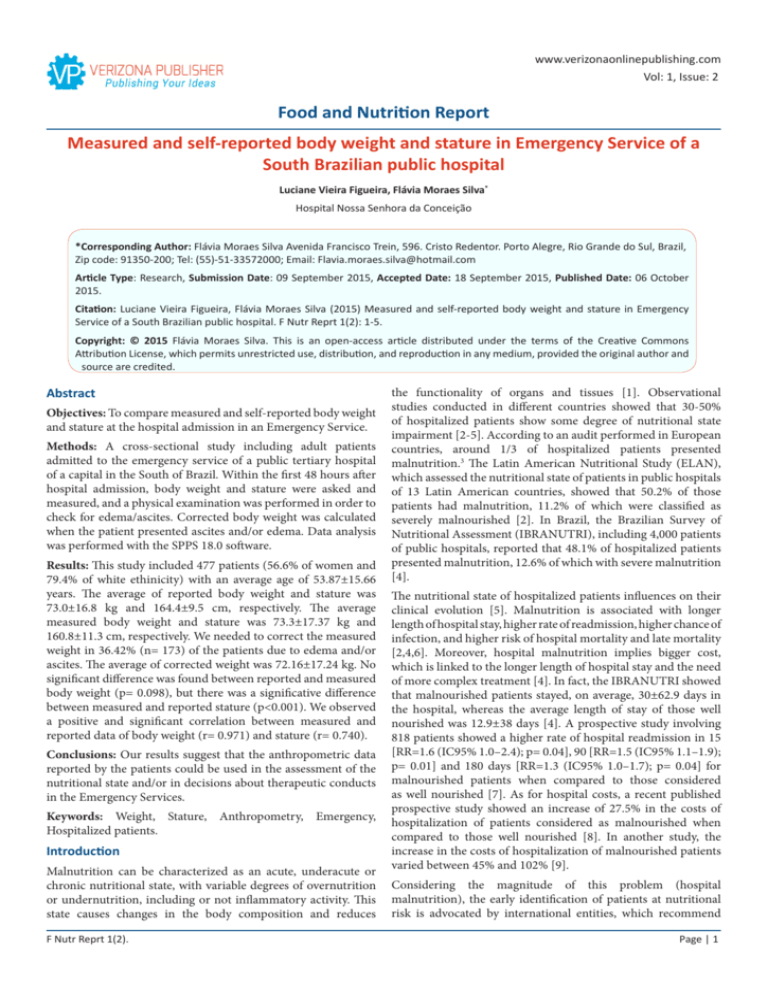
www.verizonaonlinepublishing.com Vol: 1, Issue: 2 Food and Nutrition Report Measured and self-reported body weight and stature in Emergency Service of a South Brazilian public hospital Luciane Vieira Figueira, Flávia Moraes Silva* Hospital Nossa Senhora da Conceição *Corresponding Author: Flávia Moraes Silva Avenida Francisco Trein, 596. Cristo Redentor. Porto Alegre, Rio Grande do Sul, Brazil, Zip code: 91350-200; Tel: (55)-51-33572000; Email: Flavia.moraes.silva@hotmail.com Article Type: Research, Submission Date: 09 September 2015, Accepted Date: 18 September 2015, Published Date: 06 October 2015. Citation: Luciane Vieira Figueira, Flávia Moraes Silva (2015) Measured and self-reported body weight and stature in Emergency Service of a South Brazilian public hospital. F Nutr Reprt 1(2): 1-5. Copyright: © 2015 Flávia Moraes Silva. This is an open-access article distributed under the terms of the Creative Commons Attribution License, which permits unrestricted use, distribution, and reproduction in any medium, provided the original author and source are credited. Abstract Objectives: To compare measured and self-reported body weight and stature at the hospital admission in an Emergency Service. Methods: A cross-sectional study including adult patients admitted to the emergency service of a public tertiary hospital of a capital in the South of Brazil. Within the first 48 hours after hospital admission, body weight and stature were asked and measured, and a physical examination was performed in order to check for edema/ascites. Corrected body weight was calculated when the patient presented ascites and/or edema. Data analysis was performed with the SPPS 18.0 software. Results: This study included 477 patients (56.6% of women and 79.4% of white ethinicity) with an average age of 53.87±15.66 years. The average of reported body weight and stature was 73.0±16.8 kg and 164.4±9.5 cm, respectively. The average measured body weight and stature was 73.3±17.37 kg and 160.8±11.3 cm, respectively. We needed to correct the measured weight in 36.42% (n= 173) of the patients due to edema and/or ascites. The average of corrected weight was 72.16±17.24 kg. No significant difference was found between reported and measured body weight (p= 0.098), but there was a significative difference between measured and reported stature (p<0.001). We observed a positive and significant correlation between measured and reported data of body weight (r= 0.971) and stature (r= 0.740). Conclusions: Our results suggest that the anthropometric data reported by the patients could be used in the assessment of the nutritional state and/or in decisions about therapeutic conducts in the Emergency Services. Keywords: Weight, Stature, Anthropometry, Emergency, Hospitalized patients. Introduction Malnutrition can be characterized as an acute, underacute or chronic nutritional state, with variable degrees of overnutrition or undernutrition, including or not inflammatory activity. This state causes changes in the body composition and reduces F Nutr Reprt 1(2). the functionality of organs and tissues [1]. Observational studies conducted in different countries showed that 30-50% of hospitalized patients show some degree of nutritional state impairment [2-5]. According to an audit performed in European countries, around 1/3 of hospitalized patients presented malnutrition.3 The Latin American Nutritional Study (ELAN), which assessed the nutritional state of patients in public hospitals of 13 Latin American countries, showed that 50.2% of those patients had malnutrition, 11.2% of which were classified as severely malnourished [2]. In Brazil, the Brazilian Survey of Nutritional Assessment (IBRANUTRI), including 4,000 patients of public hospitals, reported that 48.1% of hospitalized patients presented malnutrition, 12.6% of which with severe malnutrition [4]. The nutritional state of hospitalized patients influences on their clinical evolution [5]. Malnutrition is associated with longer length of hospital stay, higher rate of readmission, higher chance of infection, and higher risk of hospital mortality and late mortality [2,4,6]. Moreover, hospital malnutrition implies bigger cost, which is linked to the longer length of hospital stay and the need of more complex treatment [4]. In fact, the IBRANUTRI showed that malnourished patients stayed, on average, 30±62.9 days in the hospital, whereas the average length of stay of those well nourished was 12.9±38 days [4]. A prospective study involving 818 patients showed a higher rate of hospital readmission in 15 [RR=1.6 (IC95% 1.0–2.4); p= 0.04], 90 [RR=1.5 (IC95% 1.1–1.9); p= 0.01] and 180 days [RR=1.3 (IC95% 1.0–1.7); p= 0.04] for malnourished patients when compared to those considered as well nourished [7]. As for hospital costs, a recent published prospective study showed an increase of 27.5% in the costs of hospitalization of patients considered as malnourished when compared to those well nourished [8]. In another study, the increase in the costs of hospitalization of malnourished patients varied between 45% and 102% [9]. Considering the magnitude of this problem (hospital malnutrition), the early identification of patients at nutritional risk is advocated by international entities, which recommend Page | 1 Citation: Luciane Vieira Figueira, Flávia Moraes Silva (2015) Measured and self-reported body weight and stature in Emergency Service of a South Brazilian public hospital. F Nutr Reprt 1(2): 1-5. that the screening of nutritional risk should be performed in the first 48-72 hours after hospital admission [10]. There are various validated tools for identifying the nutritional risk in hospitalized patients: Malnutrition Universal Screening Tool [11], Nutritional Risk Screening [12], Malnutrition Screening Tool [13], Mini Nutritional Assessment [14], and Short Nutritional Assessment Questionnaire [15]. In general, the screening tools for nutritional risk include in their questionnaires the assessment of the current nutritional state of patients. This assessment usually comprises body weight and stature anthropometric data (measured or reported, depending on the tool) for the calculation of the body mass index [11,12]. Anthropometric data are important not only for screening of nutritional risk of patients in hospital admission, but also because body weight and stature data of hospitalized patients can be used for other reasons, such as adjusting medication and programming mechanical ventilation. However, in Emergency Services, obtaining anthropometric measurements is often difficult or impossible because of the structure of the services and/ or the severity of the patients’ clinical conditions. In view of this difficulty, health professionals not unusually make use of visual estimates of the body weight of patients. There are several studies in the literature that evaluated the accuracy of visual estimates of body weight by different emergency service professionals [16,17]. Hall et al showed that body weight estimates given by patients themselves are nine times more likely to match the real weight than the estimates given by health professionals [17]. Besides, in the study conducted by Anglemyer and collaborators [18], which involved 394 patients hospitalized in the Emergency Department, the mean absolute error in the weight estimate by the patients was 2.86 kg (confidence interval of 95% = 2.54 – 3.19 kg), whereas the weight estimate by the nurses showed a mean absolute error of 9.20 kg (confidence interval of 95% = 8.20 – 10.12 kg). Taking into consideration the potential impossibility to measure the body weight of patients in Emergency Services and the discrepancy between visually estimated and measured body weight, a feasible alternative for obtaining this anthropometric information is by getting it from patients themselves. Therefore, the present study aimed to comparing body weight and stature data reported and measured in a sample of patients admitted to the emergency service of a tertiary hospital in Porto Alegre (South Brazil) and the relationship of the difference between measured and self-reported data with gender, age and education level. Methods Design This is a cross-sectional observational study carried out with patients admitted to the Emergency Service of a tertiary hospital in Porto Alegre (Rio Grande do Sul, Brazil) from August 2013 to December 2014. Sample The sample was randomly selected from all patients admitted to the Emergency Service within 48 hours of hospitalization. The inclusion criteria were: patients with age > 18 years old, that were lucid and able to moving. The sample did not include pregnant women, women who had given birth less than a year before, F Nutr Reprt 1(2). patients who were unable to talk, confused, bedridden or whose measurements could not be obtained. All participants gave their informed consent prior to data collection. This study was approved by the Ethics Committee of the Grupo Hospitalar Conceição (number 360.639). Data collection Data were collected at the patients’ bedsides, by previously trained researchers, with the application of a specific questionnaire, anthropometric measurements, and a physical examination. The information gathered in the interviews with the patients included sociodemographic characteristics (gender, age, ethnicity, marital status, level of education, origin, housing conditions and socioeconomic level), as well as data related to current body weight, usual body weight, weight loss in the previous six months and stature. Information related to the admission date, reason for admission, medical history, laboratory tests and clinical outcome were obtained from electronic medical records. The anthropometric measurements were carried out after the interview with the patients, in order to avoid interference with their perception and, consequently, in the information of body weight and stature provided by them. Body weight was measured with a portable digital scale (Plena®), properly calibrated, with precision of 0.1 kg and total capacity of 150 kg. The patients were wearing as little clothing as possible and no shoes. Stature was measured with an anthropometer (Bodymeter 206, Seca®) with a total capacity of 2 meters and precision of 0.1 cm. The patients were standing, barefoot, with their backs straight, with their arms hanging down and their head straight, facing forwards. Body weight was recorded in kilograms (kg) and the stature in meters (m). The physical examination assessed the presence of edema in lower limbs and the presence of ascites, which were classified as absent, slight, moderate or severe. For those patients who were found to have edema and/or ascites, the corrected weight was calculated, considering the discount proposed by James and collaborators [19]. Data analysis The measured and reported anthropometric data were compared through of the t-test for paired samples. We calculated the difference between measured and reported anthropometric data and compared the delta for body weight (D= measured body weight – reported body weight) and the delta for stature (D= measured stature – reported stature) comparison between genders, according to age and level of education groups were performed by Mann-Whitney test for independent samples. The age group was categorized in adults (< 60 years old) and elderly (> 60 years old), whereas the level of education (years of schooling) was categorized according to the average in the sample distribution (less than or equal to seven years and longer than seven years). The quantitative data are shown as mean±standard deviation (parametrical variables) or median and interquartile range (non-parametrical variables). The qualitative data are described by absolute and relative frequencies. The data analyses were performed in the SPPS 18.0 software, and P values < 0.05 were considered as statistically significant. Page | 2 Citation: Luciane Vieira Figueira, Flávia Moraes Silva (2015) Measured and self-reported body weight and stature in Emergency Service of a South Brazilian public hospital. F Nutr Reprt 1(2): 1-5. Results General characteristics of the sample This study included 477 patients, the majority of whom (56.6%) were females. Average age was 53.87±15.66 years old. The general characteristics of the sample are described in Table 1. Table 1: General characteristics of the sample Variables Descriptive statistics Gender 271 (56.6%) Female Ethnicity 412 (79.4%) White Education (years) 7 (4 – 10) Marital status 273 (57.11%) Married Monthly income (minimum wage) 2.4 (1.65 – 3.45) Number of children at home 0 (0 – 1) Number of adults at home 2 (2 – 3) Tap water Yes 470 (98.74%) Electricity Smoking Yes 465 (100%) 116 (25.89%) Alcoholism 30 (6.68%) Yes reported by patients and those measured. There was a significant statistical difference between the measured stature data and the reported ones; the latter was higher than the former. Also, the corrected body weight was significantly lower than the measured body weight. The difference between measured and reported body weight was zero (-2.2–1.6) kg, whereas the difference between measured and corrected body weight was 0.75 (-1.27–2.7) kg. The delta between measured and reported stature was 3.0 (1.0–5.0) cm. Pearson’s correlation coefficient was calculated for body weight and stature measured and reported data: the correlation between reported and measured body weight (r=0.971, p=<0.001), reported and corrected body weight (r=0.967, p=<0.001) and measured and corrected body weight (r=0.990, p=<0.001) was positive and strong. The correlation between reported and measured stature (r=0.740, p<0.001) was positive and moderate. Anthropometric data according to the general characteristics of the sample The delta for the difference between measured and reported body weight and stature was calculated among the participants according to the gender, level of education and age group, as shown in Table 3. Table 3: Variation of anthropometric data according to general characteristics of the sample Gender Female Male P* Delta of body weight -0.40 (-2.55 – 1.20) 0.65 (-1.85 – 2.37) <0.001 Delta of stature 3.00 ( 1.00 – 6.00) 2.50 (1.00 – 4.50 ) 0.045 ≤7 years ≤7 years P* Data are shown as absolute and relative frequency or as median and interquartile range. Level of education Anthropometric characteristics of the sample Delta of body weight -0.05 (-2.30 – 1.57) 0.10 (-2.00 – 1.65) 0.741 Delta of stature 3.00 ( 1.00 – 6.50) 3.00 ( 1.00 – 4.00) 0.029 ≤60 years > 60 years P* Delta of body weight 0.00 (-2.50 – 1.60) 0.00 (-2.02 – 1.62) 0.687 Delta of stature 2.50 (1.00 – 4.00 ) 4.00 (1.50 – 7.00) The average body weight reported by the participants in this study was 73.0±16.8 kg, and the average measured body weight was 73.3±17.37 kg. The average reported stature was 164.4±9.5 cm, and the average measured stature was 160.8±11.3 cm. We needed to correct the measured bodyweight in 36.42% (n= 173) of the patients due to the presence of edema and/or ascites. The corrected average weight was 72.2±17.2 kg. The comparisons between the measured anthropometric data and those reported by the patients are shown in Table 2. No significant difference was found between the body weight data Table 2: Comparison between measured and reported anthropometric data Anthropometric variable Descriptive statistics Reported weight (Kg) 73.05±16.82 Measured weight (Kg) 73.30±17.37 Corrected weight (Kg) 72.16±17.24 Measured weight (Kg) 73.30±17.37 Reported stature (cm) 164.42±9.51 Measured stature(cm) 160.80±11.38 P-value* 0.098 <0.001 <0.001 * T-test for paired samples. Data presented as mean ±standard deviation. F Nutr Reprt 1(2). Age <0.001 *Mann–Whitney test. Data are shown as median and interquartile range. Discussion This study aimed to comparing anthropometric data of measured and reported body weight and stature in a sample of patients admitted to an Emergency Service of a tertiary hospital of South Brazil. A significant difference was only found between measured and reported stature. When the participants were compared according to gender, the delta between measured and reported body weight and between measured and reported stature differed. However, when the participants were compared according to age and education level, only the delta of stature was different. It was significantly higher in the elderly as compared to the adults and in those with lower level of education as compared to those with more years of schooling. Page | 3 Citation: Luciane Vieira Figueira, Flávia Moraes Silva (2015) Measured and self-reported body weight and stature in Emergency Service of a South Brazilian public hospital. F Nutr Reprt 1(2): 1-5. We observed a significantly strong positive correlation between measured and reported body weight. These data are in agrrement with the results of other studies available in the literature [20,21]. An observational study carried out with 3,713 adult employees of a public university in Rio de Janeiro (Brazil) has shown high concordance between measured and reported body weight (intraclass correlation coefficient = 0.977) [20]. Another crosssectional, population-based study has also found strong intraclass correlation between self-reported and measured body weight both for men and women (0.96 e 0.97; respectively) [21]. A correlation coefficient greater than 0.9 has also been demonstrated in the European cohort study about cancer investigation and nutrition (EPIC - Oxford) with 4,808 adult participants of both genders [22]. As for stature, a moderate, significant and positive correlation has been observed between measured reported data by the participants of this study. In fact, the studies mentioned above have also shown lower concordance between measured and reported stature in comparison with measured and reported body weight [20,21], which suggests that reported stature is less precise than reported body weight. has observed an average overestimate of 1.23 cm for men and 0.60 cm for women. These values are lower than those observed in the present study, in which women overestimated stature in 3.0 cm and men in 2.5 cm (data shown as median) [22]. In the study carried out in Goiânia, the stature overestimates for men and women were 0.91 and 2.2 cm, respectively. The greatest overestimates were observed among the older participants with lower level of education, as well as in the present study [21]. In the sample of patients assessed by the present study, measured body weight did not differ statistically from body weight reported by the participants. When the participants were compared according to gender, we observed a significant difference in the variation of measured and reported body weight between men and women. Men tended to underestimate body weight (variation median = 0.65), whereas women tended to overestimate it (variation median = -0.40). These data differ from those found by other studies [20,22]. In the EPIC-Oxford cohort study, underestimates of body weight have been observed both in men (average -1.85 kg) and women (average -1.40 kg) [22]. On the other hand, the Pró-Saúde study has observed body weight overestimates both in men (average 1.02 kg) and women (average 1.14 kg) [20]. Conclusions When the participants were compared according to age group and education level, no difference was found in the delta for measured and reported body weight. The study carried out with employees of a university has not demonstrated any significant difference between measured and reported body weight according to age, schooling and income [20]. On the other hand, the analysis performed with a sample of 16,573 participants of the NHANES III study has shown that the error in reported body weight data in comparison with measured body weight is influenced by age. The error is greater in individuals older than 60 years old (-0.51 kg in men and 0.56 kg in women) as compared with younger ones (-0.35 kg in men e 1.49 kg in women) [23]. In the sample of patients of the current study, the stature reported by the participants was significantly higher than the measured stature (delta median = 3.0 centimeters). This difference was also observed when the participants were compared according to gender (greater difference in women), age group (greater difference in those older than 60 years old), and education level (greater difference in those with lower level of education). In fact, stature overestimates is a common finding among the studies available in the literature: An observational study including 4,442 Swedish adults aged 18-84 has indicated an average difference between measured and reported stature of 0.60 cm for men and 0.79 cm for women [24]. The EPIC-Oxford study F Nutr Reprt 1(2). In the present study, 36.4% of the patients needed to have their body weight corrected due to the presence of edema and/or ascites. This fact could be explained by the severity of the clinical condition of patients, by the presence of malnutrition and by the fact that the majority of the patients had been sitting for over 24 hours. The median difference between measured and corrected body weight was 0.75 (-1.27–2.7) kilograms, equivalent to 1.04%. Taking into consideration that the magnitude of the difference was relatively low and that the presence of edema and ascites is commonly found in hospitalized patients, we chose by not to exclude these patients from the sample, as it is normally observed in studies that measure anthropometric data. Considering that the differences observed between reported and measured body weight and stature could not be considered relevant in the clinical practice, the anthropometric data reported by the patients could be used in the assessment of the nutritional state and/or in decisions about therapeutic conducts in Emergency Services. The difference in body weight was mainly influenced by the gender of the participants, whereas the difference in stature differs according to gender, education level and age group, which suggests that the use of self-reported stature data requires more caution, as it seem to be less precise. References 1. Mueller C, Compher C, Ellen DM, and the American Society for Parenteral and Enteral Nutrition (A.S.P.E.N.) Board of Directors. A.S.P.E.N. Clinical Guidelines: Nutrition Screening, Assessment, and Intervention in Adults. JPEN J Parenter Enteral Nutr. 2011; 35(1):1624. doi: 10.1177/0148607110389335. 2. Correia MI, Campos ACL, for the ELAN Cooperative Group. Prevalence of Hospital Malnutrition in Latin America: The Multicenter ELAN Study. Nutrition. 2003; 19:823-825. 3. Schindler K, Pernicka E, Laviano A, Howard P, Schütz T, Bauer P, et al. How nutritional risk is assessed and managed in European hospitals: A survey of 21,007 patients’ findings from the 20072008 cross–sectional nutritionDay survey. Clinical Nutrition. 2010; 29(5):552-559. doi: 10.1016/j.clnu.2010.04.001. 4. Waitzberg DL, Caiaffa WT, Correia MSTD. Hospital Malnutrition: The Brazilian National Survey (IBRANUTRI): A Study of 4000 Patients. Nutrition 2001;17(7-8):573-580. 5. Yamauti AK, Ochiai ME, Bifulco PS, Araújo MA, Alonso RR, Ribeiro RHC, et al. A avaliação subjetiva global, do estado nutricional de pacientes cardíacos. Arq. Bras. Cardiol. 2006; 87(6):772-777. doi: http://dx.doi.org/10.1590/S0066-782X2006001900014. 6. Marcadenti A, Vencatto C, Boucinha ME, Leuch MP, Rabello R, Londero LG, et al. Desnutrição, tempo de internação e mortalidade. Revista Ciência & Saúde. 2011; 4(1):7-13. Page | 4 Citation: Luciane Vieira Figueira, Flávia Moraes Silva (2015) Measured and self-reported body weight and stature in Emergency Service of a South Brazilian public hospital. F Nutr Reprt 1(2): 1-5. 7. Lim SL, Ong KC, Chan YH, Loke WC, Ferguson M, L Daniels. Malnutrition and its impact on cost of hospitalization, length of stay, readmission and 3-year mortality. ClinNutri. 2012; 31(3):34550. doi: 10.1016/j.clnu.2011.11.001. 8. Guerra RS, Sousa AS, Fonseca I, Pichel F, Restivo MT, Ferreira S, et al. Comparative analysis of undernutrition screening and diagnostic tools as predictors of hospitalisation costs. J Hum Nutr Diet. 2014. doi: 10,1111/jhn.12288. 9. Gastalver MC, Alarcón PC, Leon SM. Individualized measurement of disease-related malnutrition’s costs. ClinNutr. 2015; 34(5):951955. doi: 10.1016/j.clnu.2014.10.005. 10.Kondrup J, Allison SP, Elia M, Vellas B, Plauth M. ESPEN guidelines for nutrition screening 2002. ClinNutr. 2003; 22(4):415-421. 11.Stratton RJ, Hackston A, Longmore D, Dixon R, Price S, Stroud M, et al. Malnutrition in hospital outpatients and inpatients: prevalence, concurrent validity and ease of use of the ‘malnutrition universal screening tool’ (‘MUST’) for adults. Br J Nutr. 2004; 92(5):799-808. 12.Kondrup J, Rasmussen HH, Hamberg O, Stanga Z, ESPEN Working Group. Nutritional risk screening (NRS 2002): a new method based on an analysis of controlled clinical trials. ClinNutr. 2003; 22(3):321-336 13.Ferguson M, Capra S, Bauer J, Banks M. Development of a valid and reliable malnutrition screening tool for adult acute hospital patients. Nutrition. 1999; 6(15):458-64. 14.Guigoz Y. The Mini Nutritional Assessment (MNA) review of the literature--What does it tell us? J Nutr Health Aging. 2006; 10(6):466-87. 15.Kruizenga HM, Seidell JC, de Vet HC, Wierdsma NJ, van Bokhorst-de van der Schueren MA. Development and validation of a hospital screening tool for malnutrition: the short nutritional assessment questionnaire (SNAQ). ClinNutr. 2005; 24(1):75-82. F Nutr Reprt 1(2). 16.Hall WL, Larkin GL, Trujillo MJ, Hinds JL, Delaney KA. Errors in weight estimation in the emergency department: comparing performance by providers and patients. J Emerg Med. 2004; 27(3):219-224. 17.Lin BW, Yoshida D, Quinn J, Strehlow M. A better way to estimate adult patient’s weight. Am J Emerg Med. 2009; 27(9):1060-1064. doi: 10.1016/j.ajem.2008.08.018. 18.Anglemyer BL, Hernandez C, Brice J, Zou B. The Accuracy of Visual Estimation of Body Weight in the ED. Am J Emerg Med. 2004; 22(7):526-529. 19.JAMES R. Nutritional support in alcoholic liver disease: a review. J Human Nutrition and Dietetics. 1989; 2(5):315-323. doi : 10.1111/ j.1365-277X.1989.tb00034.x. 20.Fonseca MJM, Faerstein E, Chor D, Lopes CS. Validade de peso e estatura informados e índice de massa corporal: estudo prósaúde. Rev Saúde Pública. 2004; 38(3):392-398. doi: http://dx.doi. org/10.1590/S0034-89102004000300009. 21.Peixoto MRG, Benício MHA, Jardim PCBV. Validity of self-reported weight and height: the Goiânia study, Brazil. Rev. Saúde Pública. 2006; 40(6):1065-1072. 22.Spencer EA, Appleby PN, Davey GK, Key TJ. Validity of self-reported height and weight in 4808 EPIC–Oxford participants. Public Health Nutr. 2002; 5(4):561–565. 23.Kuczmarski MF, Kuczmarski RJ, Najjar M. Effects of age on validity of self-reported height weight, and body mass index: findings from of Third National Health and Nutrition Examination Survey, 19881994. J Am Diet Assoc. 2001; 101(1):28-34. 24.Bostrom G, Diderichsen F. Socioeconomic differentials in misclassification of height, weight and body mass index based on questionnaire data. Int J Epidemiol. 1997; 26(4):860-866. Page | 5
