Distance Speed Acceleration Graphs
advertisement
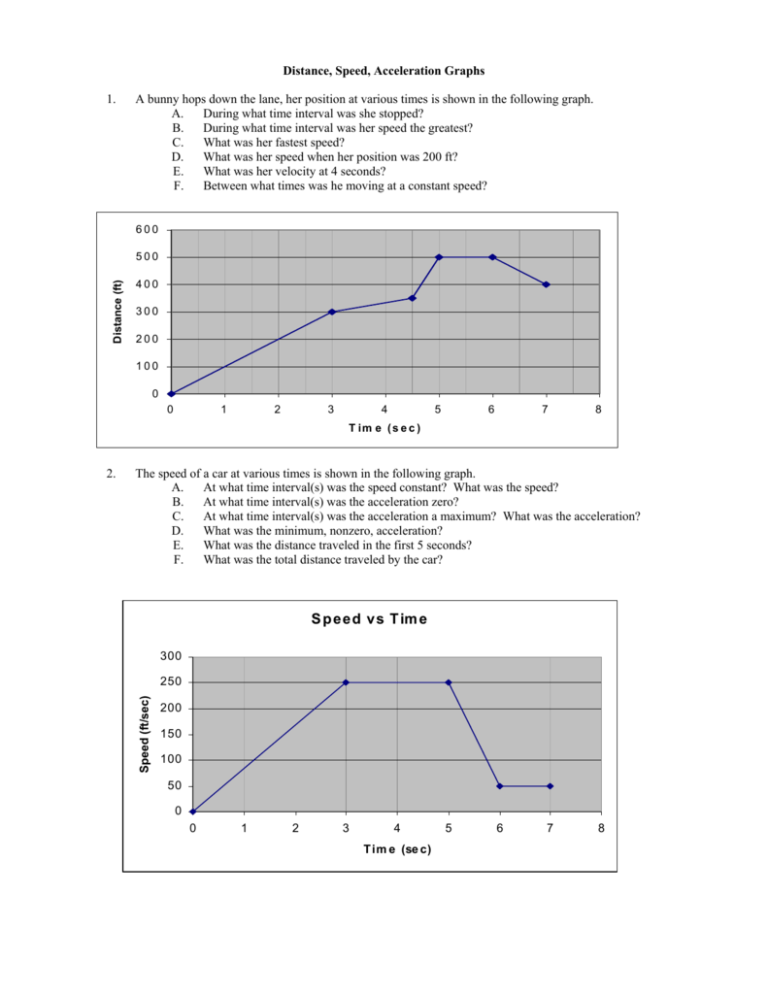
Distance, Speed, Acceleration Graphs 1. A bunny hops down the lane, her position at various times is shown in the following graph. A. During what time interval was she stopped? B. During what time interval was her speed the greatest? C. What was her fastest speed? D. What was her speed when her position was 200 ft? E. What was her velocity at 4 seconds? F. Between what times was he moving at a constant speed? 600 Distance (ft) 500 400 300 200 100 0 0 1 2 3 4 5 6 7 8 T im e ( s e c ) The speed of a car at various times is shown in the following graph. A. At what time interval(s) was the speed constant? What was the speed? B. At what time interval(s) was the acceleration zero? C. At what time interval(s) was the acceleration a maximum? What was the acceleration? D. What was the minimum, nonzero, acceleration? E. What was the distance traveled in the first 5 seconds? F. What was the total distance traveled by the car? S p eed vs T im e 300 250 Speed (ft/sec) 2. 200 150 100 50 0 0 1 2 3 4 Tim e (se c) 5 6 7 8 3. A car starting at rest speeds up uniformly to a speed of 80 ft/sec in 20 seconds, continues at this speed for 20 more seconds, and then uniformly decelerates to a stop in 30 seconds. A. Plot a graph of speed vs time for the car. Label you graph. B. From the graph, determine the maximum acceleration. C. From the graph, determine the total distance traveled by the car. 4. A ball is projected upward from the ground at a speed of 80 ft/sec. A. How long does the ball take to reach maximum height? B. How high does the ball travel? C. At what time will the ball be 96 ft above the ground? D. At what height is the ball when it is travelling at 40 m/s? 5. An object is dropped from the top of a 20 meter tall building. A. How long does it take the ball to reach the ground? B. What is the speed of the ball directly before impact? C. What is the speed of the ball 0.3 seconds after being dropped?
