Comparative Analyses of Pretest
advertisement
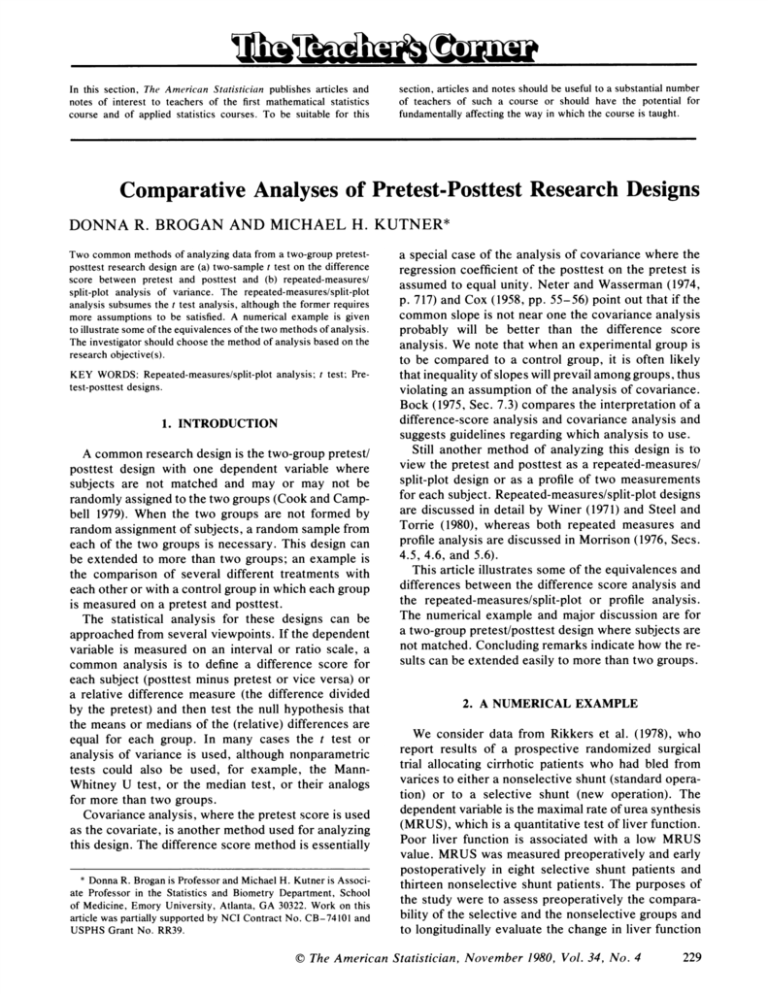
In this section, The American Statistician publishes articles and notes of interestto teachers of the firstmathematicalstatistics course and of applied statisticscourses. To be suitable for this section,articlesand notes should be usefulto a substantialnumber of teachers of such a course or should have the potential for affectingthe way in which the course is taught. fundamentally ResearchDesigns ComparativeAnalysesof Pretest-Posttest DONNA R. BROGAN AND MICHAEL H. KUTNER* Two common methodsof analyzingdata froma two-grouppretestposttestresearchdesign are (a) two-samplet test on the difference score between pretest and posttest and (b) repeated-measures/ split-plot analysis of variance. The repeated-measures/split-plot analysis subsumes the t test analysis, althoughthe formerrequires more assumptions to be satisfied. A numericalexample is given to illustratesome oftheequivalences ofthetwo methodsofanalysis. The investigatorshould choose the methodof analysis based on the researchobjective(s). analysis; t test; PreKEY WORDS: Repeated-measures/split-plot test-posttestdesigns. 1. INTRODUCTION A commonresearchdesignis the two-grouppretest/ posttest design with one dependent variable where subjects are not matched and may or may not be randomlyassignedto thetwo groups(Cook and Campbell 1979). When the two groups are not formedby randomassignmentof subjects,a randomsample from each of the two groups is necessary. This design can be extended to more than two groups; an example is the comparison of several differenttreatmentswith each otheror witha controlgroupin whicheach group is measured on a pretestand posttest. The statistical analysis for these designs can be approached fromseveral viewpoints.If the dependent variable is measured on an intervalor ratio scale, a common analysis is to definea differencescore for each subject (posttestminuspretestor vice versa) or a relative differencemeasure (the differencedivided by the pretest)and then test the null hypothesisthat the means or medians of the (relative) differencesare equal for each group. In many cases the t test or analysis of variance is used, althoughnonparametric tests could also be used, for example, the MannWhitneyU test, or the median test, or theiranalogs formore thantwo groups. Covariance analysis,wherethe pretestscore is used as the covariate,is anothermethodused foranalyzing thisdesign. The differencescore methodis essentially * Donna R. Broganis Professorand Michael H. Kutneris Associate Professorin the Statistics and BiometryDepartment,School of Medicine, Emory University,Atlanta,GA 30322. Work on this articlewas partiallysupportedby NCI ContractNo. CB-74101 and USPHS GrantNo. RR39. a special case of the analysis of covariance where the regressioncoefficientof the postteston the pretestis assumed to equal unity.Neter and Wasserman (1974, p. 717) and Cox (1958, pp. 55-56) pointout thatifthe common slope is not near one the covariance analysis probably will be better than the differencescore analysis. We note thatwhen an experimentalgroupis to be compared to a controlgroup, it is oftenlikely thatinequalityofslopes willprevailamonggroups,thus violatingan assumptionof the analysis of covariance. of a Bock (1975, Sec. 7.3) compares the interpretation analysis and covariance analysis and difference-score suggestsguidelinesregardingwhich analysis to use. Still another method of analyzingthis design is to view the pretestand posttestas a repeated-measures/ split-plotdesign or as a profileof two measurements designs foreach subject. Repeated-measures/split-plot are discussed in detail by Winer (1971) and Steel and Torrie (1980), whereas both repeated measures and profileanalysis are discussed in Morrison(1976, Secs. 4.5, 4.6, and 5.6). This articleillustratessome of the equivalences and differencesbetween the differencescore analysis and or profile analysis. the repeated-measures/split-plot The numericalexample and major discussion are for designwhere subjects are a two-grouppretest/posttest not matched.Concludingremarksindicatehow the resultscan be extendedeasily to morethantwo groups. 2. A NUMERICAL EXAMPLE We consider data fromRikkers et al. (1978), who report results of a prospective randomized surgical trial allocating cirrhoticpatients who had bled from varices to eithera nonselectiveshunt(standardoperation) or to a selective shunt (new operation). The dependentvariableis themaximalrateofurea synthesis (MRUS), whichis a quantitativetest of liverfunction. Poor liver functionis associated with a low MRUS value. MRUS was measured preoperativelyand early postoperativelyin eight selective shunt patientsand thirteennonselectiveshuntpatients.The purposes of the studywere to assess preoperativelythe comparabilityof the selective and the nonselectivegroupsand evaluate the change in liver function to longitudinally C) The American Statistician,November 1980, Vol. 34, No. 4 229 1. Pre and Post MaximalRate of Urea Synthesis Level (mg urea N/hr/kg BW314)and Sample Cell Means, by Group Group Subject Selective Shunt (new operation) 1 2 3 4 5 6 7 8 Pre Post 51 35 66 40 39 46 52 42 48 55 60 35 36 43 46 54 All = 46.375 Mean Nonselective Shunt (standard operation) /L12 = 34 40 34 36 38 32 44 50 60 63 50 42 43 9 10 11 12 13 14 15 16 17 18 19 20 21 Mean =21 /412 - /11 422 = 47.125 - 11) - (G22 - tk21) = 0 0 = 0 3. REPEATED-MEASURES ANALYSIS 31.462 of the two groups. Table 1 reportsthe MRUS values foreach patientforthepreoperativeand postoperative periods and the respectivecell means. For completeness Table 2 displays the standard repeated-measuresanalysis of variance table (analysis of means method);in thisexample the totalnumberof subjects, n, is 21. The hypotheses of interestto the researchers were the interactiontest and the simple effects test on equality of preoperative population means between groups. The test for interactionis significant(F = 11.36 with 1 and 19 df, p < .005); therefore,it is concluded that the pre/postaverage differchange in the nonselectivegroupis significantly ent fromthe pre/postaverage change in the selective group (see the figure).In the presence of a significant interactioneffectitis generallyofinterestto testsimple effectsratherthan main effects(Winer 1971, p. 529). The Bonferronimultiple-comparisonprocedure (see Neter and Wasserman 1974) was adopted to test the followingcontrasts: G412 -21 = Using an experimentwise errorrate of .05, we conclude that the interactioneffect is significantand /21 is significantly greater than 922. Therefore,significantdeteriorationof liverfunctionoccurredin the nonselectivepatientsbetween preoperativeand early postoperativeevaluationperiods,whereasthe selective group had no apparentdeleteriouseffect.Two points are worth noting in the example just cited: (a) The equality of slopes test using the preoperativeMRUS values as a covariate is rejected(p < .02); and (b) the significantinteractioneffectrequires special handling when testingthe last contrast since, for the pretest level, we have a two-groupexperimentin whichthere are no repeated measures. Therefore,the appropriate errortermfor this type of comparison is MS (within cell). For a more extensive coverage of this pointthe reader is referredto Winer(1971, pp. 529-532). 16 36 16 18 32 14 20 43 45 67 36 34 32 43.538 /21 /422- and 0 11 = We now discuss the statistical properties of the repeated-measures analysis of variance for this example and compare it withthe statisticalproperties of the differencescore analysis. Using the model proposed by Winer(1971, p. 519), we have Xijk = /U + ai + rk(i) + /3j+ a/i j + 131jk(i) + Em(ijk) (3.1) j = 1, 2 (pretest= 1, posttest= 2), i = 1, 2 (group 1 = 1, group 2 k = 1, 2, . . . , = 2), n1, m = 1, where Xijk is the observed value of subject k within groupi at timej, , is the overall mean, ai is the effectof groupi, f1k(i) is the effectof subject k nested withingroupi, ,Bjis theeffectoftherepeated-measuresvariable] (i.e., pretestand posttest), aj3ij is the interactionof groupi withlevelj of the repeated measures factor, 2. Repeated-MeasuresAnalysisof VarianceforMaximalRate of Urea SynthesisLevel 230 Source of Variation df Between Subjects Groups Subjects WithinGroups WithinGroups Pre/Post Groups x Pre/Post (Pre/Post)x Subjects WithinGroups 20 (n - 1) 1 19 (n - 2) 21 (n) 1 1 19 (n - 2) Sum of Squares Mean Squares 847.48 4440.00 847.48 (MSG) 233.68 (MSE) 317.69 407.41 681.21 317.69 (MSP) 407.4 (MSGP) 35.85 (MSPE) C The American Statistician,November 1980, Vol. 34, No. 4 F Ratio 3.63 (MSG/MSE) 8.86 (MSP/MSPE) 11.36 (MSGP/MSPE) and is the interactionof subjectk withingroupi with levelj of the repeated-measuresfactor. 50 13n1jk(i) The following constraints are imposed on the parameters: where a. = 3. a 8i. = aBJ3.j= 0, af.j= a ,8ij,and so on. coo 0 -t " z40 (3.2) In the designunderdiscussion,the repeated-measures factorand the groupfactorare each at two levels. The generalanalysis of variance also is indicatedin Table 2, where n is the total number of subjects. Note thatit is not necessaryforeach groupto contain the same number of subjects. Assuming the group factorand thepre/postfactorto be fixedeffects,Winer (1971) shows thatthe appropriateF tests are as indicated in the F ratio column of Table 2. It is worthnotingexactly what null hypothesesare tested in Table 2. The ratio MSG/MSEtests the null hypothesisthatthereis no group main effect.This is equivalentto testingwhetherthesum ofthepretestand posttest observations on each subject has the same populationmeaninthetwogroups.The ratioMSP/MSpE tests the nullhypothesisthatthereis no prelpostmain effectand is equivalentto testingwhetherthe population mean of the pretestobservationsis the same as the populationmean of the posttestobservations.The ratio MSGP/MSPE teststhe null hypothesisthatthereis no interactionbetween the group main effectand the pre/postmain effect.This ratio also tests whetherthe differencebetween pretestand posttest observations has the same populationmean in both groups. This is the test manyresearchersare interestedin when using this research design, since they oftenwish to assess has had any effectupon an experiwhethera treatment mentalgroup. Note thatthisF test has (1, n - 2) df, which will correspondto the t test with(n - 2) df,as discussed in the next section. Two assumptionsare requiredto arriveat theF tests indicatedin Table 2 (Winer 1971). 1. The pretest and posttest population variancecovariance matricesforeach group are assumed equal. 2. The randomeffectsHk(i), PIjk(i), and Em(Ujk) from the model in (3.1) are all independentlyand withmeanzero and variances normallydistributed ( and OE2, cH2, respectively. I2. (TO Assumption(1), equalityof the variance-covariance matrices,impliestwo otherresultsworthnoting.First, the variation of subjects within the two groups is homogeneous. That is, if each subject's pretestand posttestobservationsare added together,thissum has the same population variance in both groups. This allows pooling over groups to calculate SSE. Second, the variationof the interactionof subject and the pre! post factoris homogeneousforthetwo groups.That is, if the differencescore between pretestand posttestis N E Shunt v e ~~~Selective ~~~o--o NonselectiveShuntb - 30 E Post (AfterSu rgery) Pre (Before Su rgery) Mean Pre and Post />aximal Rate of Urea Synthesis Level (MRUS) by Type of Surgery defined for each subject, the population variance of the difference scores is the same for both groups. This allows pooling over groups to calculate SSPE:. 4. DIFFERENCE-SCORE ANALYSIS Using dik dik model (3.1) and forming a difference score for each subject k nested in group i yields = Xi2k Xilk- = (,31 - + P2) +(Befor Sureir) Poslk(i)(t + (Em(ilk) Srk(r) EM(i2k)) * (4 .1) - a,8i2) iS a parameter associatedwith The term(MR,US group i and measures the "effect" of group i on the differencescore dik. The null hypothesisto be tested - a12 is How pooli - ove12=g p21 - cal22 or l1 Ho: = Ui821 - md822 = a.The differencescores in (4.1) can be viewed as a one-way classification model in which the errortermis the sum of the followingtwo terms: (WIlk(i) - P2k(i)) and (Em(ilk) - Em(2k)) If we assume this errortermand also homogeneous variances forthe two groups, an appropriatetest statisticis the Studentt testfortwo independentsamples with (n - 2) df. theerortrmi the sum of the followin poteteifrms: two 5. COMPARISON OF THE TWO ANALYSES homogeneousedt term an tw-amlso weassmchisberro Ifo thetogroups m ans appropriatetheststavracesmfore The followingthree results are useful computationally samples t tes for0 two indtepsuaendent titcaisltheStden and can be verifiedeasily with the example from etfrGop nTbe2with df. F(n1,12) C The American Statistician,November 1980, Vol. 34, No. 4 231 2. Ifthedifference betweenthepretestand theposttest is formedforeach subject and a two-sample t testis used to comparethegroupmeans ofthese differences,thenthe calculated t = 3.371 and is thesquare rootoftheF testforGroupsx (pre/post) in Table 2 with(1,19) df. 3. Ifall 21 subjectsare consideredto be inone group, thenthe t statisticto test the nullhypothesisthat the mean differencescore is zero has 20 df and equals 3.158. From Table 2, if we reanalyze the within-subjectscomponentby assumingthatthe Group x (pre/post)interactionis zero and SSGP is pooled with SSPE, then the F test for the main effectpre/postyields F = 9.97 with (1,20) df, whichequals thesquareoftheprecedingt statistic. These resultsdemonstratethatthevariousF testsin the repeated-measuresanalysis of variance can be obtainedby usingsimplet testson linearcombinations ofthepreand post scores. It can be shownalgebraically thatinterpretations (1), (2), and (3) of theF tests hold in the particular research design discussed in this article,thatis, a two-grouppretest/posttest design. In fact,thenumericaloperationsin (1) and (2) of summing and differencing observationsare the pretest/posttest used by the latestversionof the BMD P2V programin calculatingsums of squares in repeated-measuresdesigns (Dixon and Brown 1979). Since the difference-score analysis is embedded in therepeated-measuresanalysis,therepeated-measures about the data at analysis provides more information hand. Fewer assumptions,however,are requiredinthe difference-score analysis.The difference-score analysis assumes only homogeneous variances for the difference scores and a normallydistributederrortermwith mean zero. It is easy to show thatif the assumptions oftherepeated-measuresanalysisare satisfied,thenthe assumptionsof the difference-score analysis are also met. However, the converse is not true. In our experience,theresearcherrarelyis interested in onlytheinteractiontest,thatis, thedifference-score analysis. Furthermore,simpleeffectsare commonlyof interesteven in the no interactioneffectexperiments. Therefore, we advocate the use of the repeatedmeasures/split-plot analysis in most instances. However, we urge the user to empiricallyvalidate the underlyingassumptions. In theexamplediscussedin Section2, theresearchers wouldhave been interestedinassessingthesignificance 232 of the main effecttime (pre vs. post) if the Groups x pre/postinteractionhad been nonsignificant. That is, thenonsignificant interactionwould have indicatedthat the two groups did not differsignificantly on their MRUS differencescores. The pre/postmaineffecttest would then indicate whether the MRUS difference score in both groups was significantly from different zero, that is, whetherthe treatmentdid or did not effectboth groups. 6. GENERALIZATION OF FINDINGS If there are more than two groups, similarresults can be obtained. The difference-score analysis would no longerbe performedby a t test but by an F test in a one-way analysis of variance. A furtherextension can be made wherethedifferent groupsbeingcompared maybe definedby severalfactorsin a factorialdesign. However, there is no logical extension of this discussion to more than two levels of the repeatedmeasuresfactorsince a simpledifference score analysis would no longerbe appropriate. [Received July1977. Revised June 1980.] REFERENCES Bock, R. Darrell (1975), Multiv'ariate Statistical Methods in? Behavioral Research, New York: McGraw-Hill Book Co. Cook, Thomas D., and Campbell, Donald T. (1979), QuasiExperimentation:Design and Analysis IssiuesJorField Settings, Chicago: Rand McNally. Cox, D.R. (1958), Planning of Experiments, New York: John Wiley & Sons. Dixon, WilfredJ., and Brown, MortonB. (eds.) (1979), Biomedical ComputerProgramsP-Series, Berkeley:Universityof California Press. Morrison,Donald F. (1976), MultivariateStatistical Methods (2nd ed.), New York: McGraw-HillBook Co. Neter, John, and Wasserman, William (1974), Applied Linear StatisticalModels, Homewood, Ill.: Richard D. Irwin. Rikkers,Layton F., Rudman, Daniel, Galambos, JohnT., Fulenwider, J. Timothy, Milliken, William J., Kutner, Michael H., Smith,Robert B., Salam, AtefA., Sones, Peter J., and Warren, W. Dean (1978), "A Randomized, ControlledTrial of the Distal Spenorenal Shunt," Annals of Surgery,188, 271-282. Steel, Robert G.D., and Torrie, James H. (1980), Principles anld Procediures of Statistics (2nd ed.), New York: McGraw-Hill Book Co. Winer, B.J. (1971), Statistical Principles in ExperimentalDesign (2nd ed.), New York: McGraw-HillBook Co. (? The AmericanStatistician,November 1980, Vol. 34, No. 4
