Background & Highlights Assumptions & Methods Limitations
advertisement
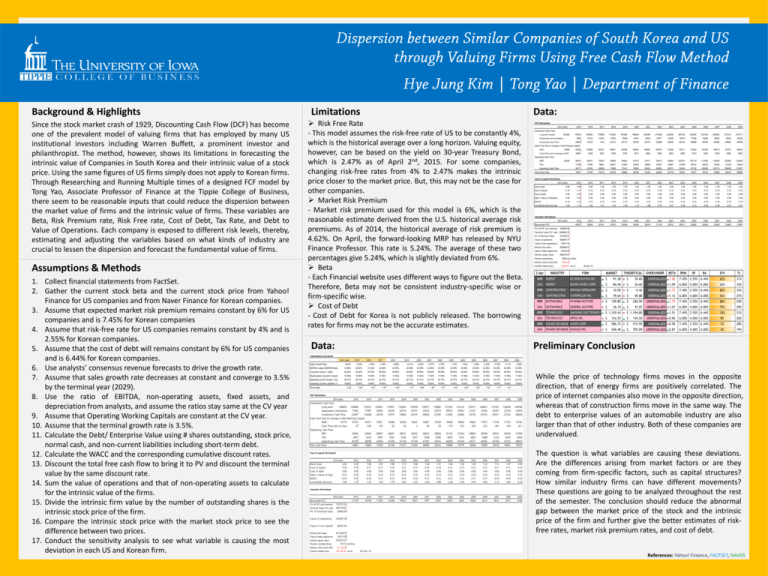
Background & Highlights Since the stock market crash of 1929, Discounting Cash Flow (DCF) has become one of the prevalent model of valuing firms that has employed by many US institutional investors including Warren Buffett, a prominent investor and philanthropist. The method, however, shows its limitations in forecasting the intrinsic value of Companies in South Korea and their intrinsic value of a stock price. Using the same figures of US firms simply does not apply to Korean firms. Through Researching and Running Multiple times of a designed FCF model by Tong Yao, Associate Professor of Finance at the Tippie College of Business, there seem to be reasonable inputs that could reduce the dispersion between the market value of firms and the intrinsic value of firms. These variables are Beta, Risk Premium rate, Risk Free rate, Cost of Debt, Tax Rate, and Debt to Value of Operations. Each company is exposed to different risk levels, thereby, estimating and adjusting the variables based on what kinds of industry are crucial to lessen the dispersion and forecast the fundamental value of firms. Assumptions & Methods 1. Collect financial statements from FactSet. 2. Gather the current stock beta and the current stock price from Yahoo! Finance for US companies and from Naver Finance for Korean companies. 3. Assume that expected market risk premium remains constant by 6% for US companies and is 7.45% for Korean companies 4. Assume that risk-free rate for US companies remains constant by 4% and is 2.55% for Korean companies. 5. Assume that the cost of debt will remains constant by 6% for US companies and is 6.44% for Korean companies. 6. Use analysts’ consensus revenue forecasts to drive the growth rate. 7. Assume that sales growth rate decreases at constant and converge to 3.5% by the terminal year (2029). 8. Use the ratio of EBITDA, non-operating assets, fixed assets, and depreciation from analysts, and assume the ratios stay same at the CV year 9. Assume that Operating Working Capitals are constant at the CV year. 10. Assume that the terminal growth rate is 3.5%. 11. Calculate the Debt/ Enterprise Value using # shares outstanding, stock price, normal cash, and non-current liabilities including short-term debt. 12. Calculate the WACC and the corresponding cumulative discount rates. 13. Discount the total free cash flow to bring it to PV and discount the terminal value by the same discount rate. 14. Sum the value of operations and that of non-operating assets to calculate for the intrinsic value of the firms. 15. Divide the intrinsic firm value by the number of outstanding shares is the intrinsic stock price of the firm. 16. Compare the intrinsic stock price with the market stock price to see the difference between two prices. 17. Conduct the sensitivity analysis to see what variable is causing the most deviation in each US and Korean firm. Limitations Data: Risk Free Rate - This model assumes the risk-free rate of US to be constantly 4%, which is the historical average over a long horizon. Valuing equity, however, can be based on the yield on 30-year Treasury Bond, which is 2.47% as of April 2nd, 2015. For some companies, changing risk-free rates from 4% to 2.47% makes the intrinsic price closer to the market price. But, this may not be the case for other companies. Market Risk Premium - Market risk premium used for this model is 6%, which is the reasonable estimate derived from the U.S. historical average risk premiums. As of 2014, the historical average of risk premium is 4.62%. On April, the forward-looking MRP has released by NYU Finance Professor. This rate is 5.24%. The average of these two percentages give 5.24%, which is slightly deviated from 6%. Beta - Each Financial website uses different ways to figure out the Beta. Therefore, Beta may not be consistent industry-specific wise or firm-specific wise. Cost of Debt - Cost of Debt for Korea is not publicly released. The borrowing rates for firms may not be the accurate estimates. Data: FCF Worksheet 2014 (last) 2015 2016 2017 2018 2019 2020 2021 2022 2023 2024 2025 2026 2027 2028 2029 178542 184552 170988 179330 187855 196549 205399 214390 223506 232729 242042 251423 260853 270310 279771 9602 10723 12424 13030 13649 14281 14924 15577 16239 16910 17586 18268 18953 19640 20328 -24835 -16734 1140 -21372 -22173 -22975 -23774 -24568 -25355 -26133 -26899 -27649 -28383 -29097 -29788 -50287 -52695 -55331 -58031 -60789 -63603 -66467 -69376 -72326 -75311 -78324 -81360 -84412 -87472 -90533 36601 2408 2637 2699 2758 2813 2864 2909 2950 2985 3013 3036 3052 3060 3062 66477 68761 76097 79809 83603 87472 91411 95412 99469 103574 107718 111893 116090 120299 124509 TAX 17368 17965 19881 20851 21842 22853 23882 24927 25987 27060 28142 29233 30330 31429 32529 Operating Cash Flow 58711 61520 68639 71988 75410 78900 82452 86062 89721 93424 97162 100928 104713 108509 112307 70477 47194 72416 53316 55995 58738 61542 64403 67316 70275 73277 76314 79382 82473 85580 2015 2016 2017 2018 2019 2020 2021 2022 2023 2024 2025 2026 2027 2028 2029 Investment Cash Flow 163308 Long-term Assets Depreciation & Amortization Investment Cash Flow Cash Flow Due to change in Net Working Capital -13686 NWC Cash Flow due to change in NWC Operating Cash Flow EBIT 52349 Free Cash Flow Cost of capital Worksheet 2014 (last) Stock beta 0.99 0.99 0.99 1.00 1.00 1.00 1.00 1.00 1.00 1.00 1.00 1.00 1.00 1.00 1.00 1.00 Cost of equity 0.10 0.10 0.10 0.10 0.10 0.10 0.10 0.10 0.10 0.10 0.10 0.10 0.10 0.10 0.10 0.10 Cost of debt 0.06 0.06 0.06 0.06 0.06 0.06 0.06 0.06 0.06 0.06 0.06 0.06 0.06 0.06 0.06 0.06 Debt / Value of Operations 0.08 0.08 0.08 0.08 0.08 0.08 0.08 0.08 0.08 0.08 0.08 0.08 0.08 0.08 0.08 0.08 WACC 0.10 0.10 0.10 0.10 0.10 0.10 0.10 0.10 0.10 0.10 0.10 0.10 0.10 0.10 0.10 0.10 cumulative discount rate 1.00 1.10 1.20 1.31 1.44 1.58 1.73 1.89 2.07 2.27 2.48 2.72 2.98 3.26 3.57 3.91 2015 2016 2017 2018 2019 2020 2021 2022 2023 2024 2025 2026 2027 2028 2029 64357 39354 55141 37070 35549 34050 32574 31124 29702 28311 26952 25626 24336 23083 21867 Valuation Worksheet 2014 (last) Discounted FCF PV of FCF up to terminal year 509096.56 Terminal Value (TV, evaluated 1466856.25 at terminal year) PV of Terminal Value 374795.41 Value of operations 883891.97 Value of non-opearting assets25077.00 (cash & ST investments) Intrinsic firm value 908968.97 Value of debt (approximated 63152.00 by book value of debt) Intrinsic equity value Shares outstanding 845816.97 5825.00 million Intrinsic stock price (intrinsic stock $145.20 price) Current market price 2-Apr $124.25 as of: INDUSTRY 02-Apr-15 FIRM MARKET THEORITICAL OVER/UNDER BETA RPM Rf Rd D/V Tc KOR ENERGY SK INNOVATION INC. $ 91.38 $ 39.60 OVERVALUED 1.80 7.45% 2.55% 6.44% 62% 31% USA ENERGY EXXON M OBIL CORP. $ 84.46 $ 36.60 OVERVALUED 1.09 6.00% 4.00% 6.00% 26% 35% KOR CONSTRUCTION DOOSAN INFRACORE $ 10.05 $ -5.42 OVERVALUED 1.73 7.45% 2.55% 6.44% 82% 32% USA CONSTRUCTION CATERPILLAR INC. $ 79.64 $ 49.88 OVERVALUED 1.12 6.00% 4.00% 6.00% 56% 27% KOR AUTOM OBILE HYUNDAI M OTORS $ 149.85 $ 246.59 UNDERVALUED 1.73 7.45% 2.55% 6.44% 86% 24% USA AUTOM OBILE GENERAL M OTORS $ 36.74 $ 47.07 UNDERVALUED 1.07 6.00% 4.00% 6.00% 75% 29% KOR TECHNOLOGY SAM SUNG ELECTRONICS $ 1,310.43 $ 1,194.80 OVERVALUED 1.51 7.45% 2.55% 6.44% 10% 21% USA TECHNOLOGY APPLE INC. $ 124.25 $ 145.20 UNDERVALUED 0.96 6.00% 4.00% 6.00% 8% 26% KOR ONLINE DATABASE NAVER CORP. $ 586.72 $ 515.95 OVERVALUED 0.58 7.45% 2.55% 6.44% 3% 28% USA ONLINE DATABASE GOOGLE INC. $ 549.49 $ 795.09 UNDERVALUED 0.87 6.00% 4.00% 6.00% 4% 19% Preliminary Conclusion Assumptions and Inputs 2014 (last) 2015 2016 2017 2018 2019 2020 2021 2022 2023 2024 2025 2026 2027 2028 2029 Sales Growth Rate -6.23% 0.33% 3.19% -1.20% -0.80% -0.41% -0.02% 0.37% 0.76% 1.15% 1.54% 1.93% 2.33% 2.72% 3.11% 3.50% EBITDA margin (EBITDA/Sales) 19.99% 20.92% 21.52% 23.59% 23.59% 23.59% 23.59% 23.59% 23.59% 23.59% 23.59% 23.59% 23.59% 23.59% 23.59% 23.59% Long-term Assets / Sales 53.54% 55.92% 57.29% 59.90% 59.90% 59.90% 59.90% 59.90% 59.90% 59.90% 59.90% 59.90% 59.90% 59.90% 59.90% 59.90% Depreciation/Long-term Assets 15.09% 15.89% 15.49% 17.00% 17.00% 17.00% 17.00% 17.00% 17.00% 17.00% 17.00% 17.00% 17.00% 17.00% 17.00% 17.00% Operating Current Assets / Sales 24.77% 24.77% 24.77% 24.77% 24.77% 24.77% 24.77% 24.77% 24.77% 24.77% 24.77% 24.77% 24.77% 24.77% 24.77% 24.77% Operating Current Liabilities / Sales 19.60% 19.60% 19.60% 19.60% 19.60% 19.60% 19.60% 19.60% 19.60% 19.60% 19.60% 19.60% 19.60% 19.60% 19.60% 19.60% 2.02 2.02 1.95 1.87 1.80 1.73 1.66 1.58 1.51 1.44 1.36 1.29 1.22 1.15 1.07 1 Stock Beta FCF Worksheet 2014 (last) 2015 2016 2017 2018 2019 2020 2021 2022 2023 2024 2025 2026 2027 2028 2029 109896 116187 Depreciation & Amortization 17463 17997 Investment Cash Flow -22481 -24288 Cash Flow Due to change in Net Working Capital NWC 10119 10153 10477 Cash Flow due to change in NWC -33 -324 Operating Cash Flow EBIT 23645 25642 TAX 4927 5343 Operating Cash Flow 36180 38296 120022 20403 -24239 119057 20239 -19274 118565 20155 -19664 118539 20151 -20125 118977 20225 -20663 119882 20379 -21285 121263 20614 -21995 123135 20932 -22804 125517 21337 -23720 128437 21834 -24753 131927 22427 -25917 136028 23124 -27225 140789 23933 -28694 10351 125 10268 83 10226 42 10223 2 10261 -38 10339 -78 10458 -119 10620 -161 10825 -205 11077 -252 11378 -301 11732 -354 12142 -411 26857 5597 41664 26641 5552 41328 26531 5529 41158 26525 5527 41149 26623 5548 41301 26826 5590 41615 27135 5655 42094 27554 5742 42744 28087 5853 43571 28740 5989 44585 29521 6152 45796 30439 6343 47220 31504 6565 48873 17550 22138 21537 21026 20600 20252 19980 19779 19646 19580 19578 19641 19767 Investment Cash Flow Long-term Assets 104878 Free Cash Flow 13667 13684 Cost of capital Worksheet 2014 (last) Stock beta Cost of equity Cost of debt Debt / Value of Operations WACC cumulative discount rate 2015 2016 2017 2018 2019 2020 2021 2022 2023 2024 2025 2026 2027 2028 2029 2.02 0.18 0.06 0.10 0.16 1.16 1.95 0.17 0.06 0.10 0.16 1.35 1.87 0.17 0.06 0.10 0.15 1.56 1.80 0.16 0.06 0.10 0.15 1.79 1.73 0.15 0.06 0.10 0.14 2.04 1.66 0.15 0.06 0.10 0.14 2.33 1.58 0.14 0.06 0.10 0.13 2.64 1.51 0.14 0.06 0.10 0.13 2.98 1.44 0.13 0.06 0.10 0.12 3.36 1.36 0.13 0.06 0.10 0.12 3.76 1.29 0.12 0.06 0.10 0.11 4.19 1.22 0.12 0.06 0.10 0.11 4.65 1.15 0.11 0.06 0.10 0.10 5.13 1.07 0.11 0.06 0.10 0.10 5.65 1.00 0.10 0.06 0.10 0.10 6.19 2015 2016 2017 2018 2019 2020 2021 2022 2023 2024 2025 2026 2027 2028 2029 11745 10149 11282 12386 10532 9027 7797 6787 5955 5265 4692 4213 3813 3477 3196 2.02 0.18 0.06 0.10 0.16 1.00 Valuation Worksheet 2014 (last) Discounted FCF PV of FCF up to terminal year 110315.26 Terminal Value (TV, evaluated 340178.67 at terminal year) PV of Terminal Value Value of operations 54992.04 165307.29 Value of non-opearting assets 56241.04 (cash & ST investments) 221548.33 Value of debt (approximated by 18313.08 book value of debt) Intrinsic equity value 203235.25 Shares outstanding 170.10 million Intrinsic firm value While the price of technology firms moves in the opposite direction, that of energy firms are positively correlated. The price of internet companies also move in the opposite direction, whereas that of construction firms move in the same way. The debt to enterprise values of an automobile industry are also larger than that of other industry. Both of these companies are undervalued. The question is what variables are causing these deviations. Are the differences arising from market factors or are they coming from firm-specific factors, such as capital structures? How similar industry firms can have different movements? These questions are going to be analyzed throughout the rest of the semester. The conclusion should reduce the abnormal gap between the market price of the stock and the intrinsic price of the firm and further give the better estimates of riskfree rates, market risk premium rates, and cost of debt. Intrinsic stock price (intrinsic stock $1,194.80 price) Current market price $1,310.43 as of: 02-Apr-15 References: Yahoo! Finance, FACTSET, NAVER
