Physics Lab Quiz - VCC Library
advertisement
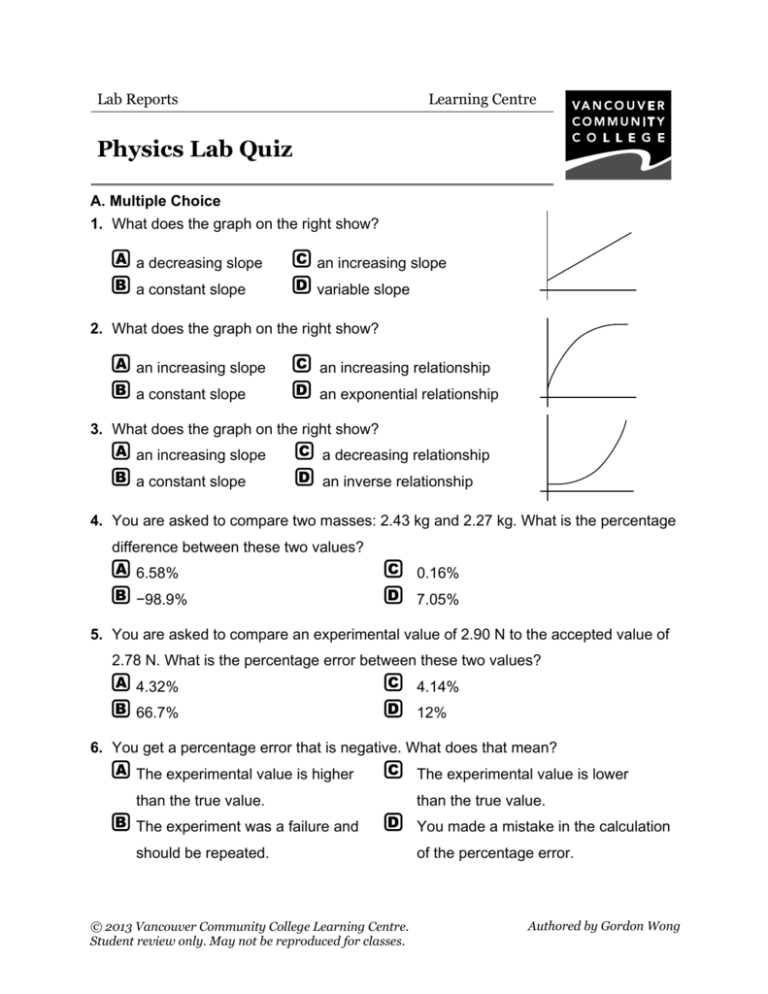
Lab Reports Learning Centre Physics Lab Quiz A. Multiple Choice 1. What does the graph on the right show? a decreasing slope an increasing slope a constant slope variable slope 2. What does the graph on the right show? an increasing slope an increasing relationship a constant slope an exponential relationship 3. What does the graph on the right show? an increasing slope a decreasing relationship a constant slope an inverse relationship 4. You are asked to compare two masses: 2.43 kg and 2.27 kg. What is the percentage difference between these two values? 6.58% 0.16% −98.9% 7.05% 5. You are asked to compare an experimental value of 2.90 N to the accepted value of 2.78 N. What is the percentage error between these two values? 4.32% 4.14% 66.7% 12% 6. You get a percentage error that is negative. What does that mean? The experimental value is higher The experimental value is lower than the true value. than the true value. The experiment was a failure and You made a mistake in the calculation should be repeated. of the percentage error. © 2013 Vancouver Community College Learning Centre. Student review only. May not be reproduced for classes. Authoredby byEmily Gordon Wong Simpson 7. What is the reason for drawing a diagram of the experimental setup in your lab report? To prepare you for art school in To let your teacher check that you set case you don’t make it in science. up your experiment correctly. To keep the reader from falling To give the reader an idea of what the asleep by presenting something experimental setup consisted of. visually pleasing. 8. When the line of best fit has been drawn through your data, why should further calculations be done only with points from the line, instead of your data points? This isn’t the case. According to The line has “smoothed” the data and math, any two points from the data is a more consistent model for the table form a line. data. This isn’t the case. Any two points Because all the data points are on the close to the line could be used. line of best fit. 9. What should go in the conclusion section of a lab report? Presentation of additional material Your opinions regarding the lab and its that doesn’t fit in the other sections. impact on scientific advancement. Brief statements of the conclusions A summary of conclusions drawn and drawn based on the results. how the experiment was conducted. 10. The report should be written in the passive voice, past tense. Which of the following statements is in the passive voice and past tense? Clamp the timer to the table. I clamped the timer to the table. There is a timer clamped to the The timer was clamped to the table. table. 11. What comes next in the following sequence: 0.07, 0.08, 0.09, … 0.010, 0.011, 0.012 1.00, 1.10, 1.20 0.10, 0.11, 0.12 0.1, 0.1, 0.1 © 2013 Vancouver Community College Learning Centre. Student review only. May not be reproduced for classes. 2 12. After an experiment, where time was measured in seconds, the time values are squared before being plotted on a graph. How should this axis be labelled? Time (min) Time2 (s2) Time (s2) Square time (ss) 13. Suppose the reciprocal of time in seconds was plotted on a graph. How should the axis be labelled? Time (ms) Reciprocal time (s) 1/Time (s−1) 1/Time (Time in s) 14. Why should you show sample calculations? To show the reader how your To show the reader that you know numbers were arrived at. what you’re talking about. To practice your math skills. So your teacher can give you part marks if there are mistakes. 15. If you are asked to plot velocity against time, or to draw a velocity vs. time graph, which of the following should you do? Plot distance on the vertical axis Plot velocity on the vertical axis and time on the horizontal axis. and time on the horizontal axis. Plot time on the vertical axis and Plot time on the vertical axis and distance on the horizontal axis. velocity on the horizontal axis. 16. Which of the following is true about mass and weight? Mass and weight are the same. Weight is mass times 9.8, and in N. Mass is weight times 9.8, and in kg. Mass is always the same for an object, but its weight can change. 17. What is the value for g to be used in all experiments? 9.8 m⁄s² 9.80665 m⁄s² 10 m⁄s² 9.81 m⁄s © 2013 Vancouver Community College Learning Centre. Student review only. May not be reproduced for classes. 3 18. If mass (g) was multiplied by distance (cm), the units would be: g/cm mN N g·cm 19. What would be the proper way to label the axis if voltage in volts was being plotted? Volts (V) V (V) Voltage (Volts) Voltage (V) 20. Your data points indicate a curve. What should you do? Repeat the experiment, since there Draw the best line through the data must be something wrong. points. Draw the best curve through the Draw a series of straight lines from points. data point to data point. B. Short Answer 1. If you obtain a straight line for the following plots, what quantity is constant and equivalent to slope? a) distance vs. time d) force vs. acceleration b) mass vs. volume e) voltage vs. current c) velocity vs. time f) power vs. current 2. Referring to question 1, what units would slope have if the plotted quantities have the following units? a) distance (m) vs. time (s) d) force (N) vs. acceleration (m⁄s²) b) mass (g) vs. volume (mL) e) voltage (V) vs. current (A) c) velocity (m⁄s) vs. time (s) f) power (W) vs. current (A) SOLUTIONS A. (1) B (2) C (3) A (4) D (5) A (6) C (7) D (8) C (9) B (10) D (11) B (12) C (13) B (14) A (15) C (16) D (17) A (18) D (19) D (20) B B. (1)a) velocity (b) density (c) acceleration (d) mass (e) resistance (f) voltage (2)a) m⁄s (b) g⁄mL (c) m⁄s² (d) kg (since 1 N = 1 kg·m⁄s²) (e) Ω (f) V © 2013 Vancouver Community College Learning Centre. Student review only. May not be reproduced for classes. 4

