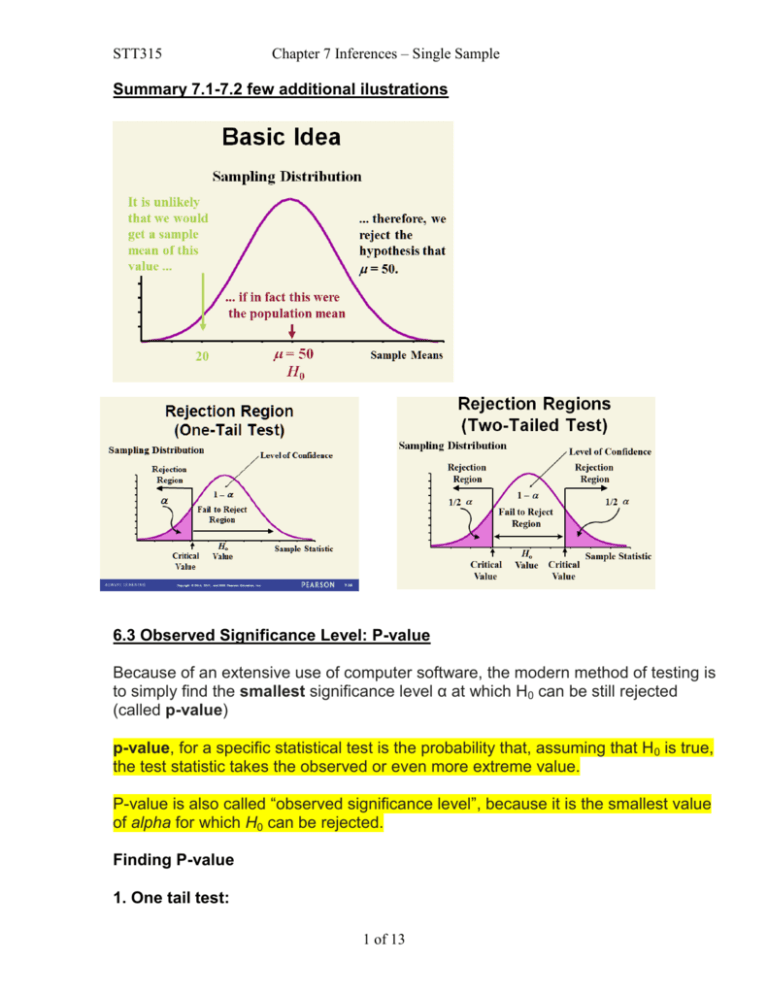
Summary 7.1-7.2 few additional ilustrations 6.3 Observed
advertisement

STT315 Chapter 7 Inferences – Single Sample Summary 7.1-7.2 few additional ilustrations 6.3 Observed Significance Level: P-value Because of an extensive use of computer software, the modern method of testing is to simply find the smallest significance level α at which H0 can be still rejected (called p-value) p-value, for a specific statistical test is the probability that, assuming that H0 is true, the test statistic takes the observed or even more extreme value. P-value is also called “observed significance level”, because it is the smallest value of alpha for which H0 can be rejected. Finding P-value 1. One tail test: 1 of 13 STT315 Chapter 7 Inferences – Single Sample If Ha: parameter < a (left, or lower tail test) find test statistic and then find the area under the graph to the left of the statistic: P-value=normalcdf( -10^9, test statistic) If Ha: parameter > a (right, or upper tail test) find test statistic and then find the area under the graph to the right of the statistic: P-value=normalcdf(test statistic, 10^9) 2. Two-tails test: If Ha: parameter ≠ a find test statistic, then find the area under the graph on a tail marked by the test statistic and MULTIPLY BY 2: Making a decision while basing on P-value If P-value < α reject null hypothesis (and support alternative) If P-value > α fail to reject null hypothesis (not enough evidence to support alternative) Exercises: Learning the Mechanics 7.19 Consider the test of H 0 : μ = 7 . For each of the following, find the p-value of the test: a. H a : μ > 7 , z = 1.20 b. H a : μ < 7 , z = − 1.20 c. H a : μ ≠ 7 , z = 1.20 2 of 13 STT315 Chapter 7 Inferences – Single Sample 7.21 For each α and observed significance level (p-value) pair, indicate whether the null hypothesis would be rejected. a. α = .05 , p -value = .10 b. α = .10 , p -value = .05 7.24 In a test of the hypothesis H 0 : μ = 10 versus H a : μ ≠ 10 , a sample of n = 50 observations possessed mean x ¯ = 10.7 and standard deviation s = 3.1 . Find and interpret the p-value for this test. 7.26 In a test of H 0 : μ = 75 performed using the computer, SPSS reports a twotailed p-value of .1032. Make the appropriate conclusion for each of the following situations: c. H a : μ > 75 , z = 1.63 , α = .10 d. H a : μ ≠ 75 , z = − 1.63 , α = .01 Exercise: In a test of the hypothesis HO: µ= 10 versus Ha: µ< 10 a sample of n = 50 observations possessed mean 9.2 and standard deviation s = 3.1. a. Find the observed value of the test statistics …………………………………… b. Find, draw, and interpret the p-value for this test. P-value = …………… Interpretation ……………………………………… c. What is your conclusion at significance level α = 0.01 …………………… d. What is your conclusion at significance level α = 0.025…………………… e. What is your conclusion at significance level α = 0.05 …………………… f. What is your conclusion at significance level α = 0.10 …………………… 7.4 Test of Hypothesis about a Population Mean μ: Normal (z) Statistic When testing a hypothesis about a population mean μ, the test statistic we use will depend on whether the sample size n is large (say, n ≥ 30) or small, and whether or not we know the value of the population standard deviation σ, This section treats the large-sample case. Large-Sample Test of Hypothesis about a Population Mean μ 3 of 13 STT315 Chapter 7 Inferences – Single Sample 1. Assumptions: a. Random sample b. Large sample size n (n ≥ 30) c. The population standard deviation σ known d. No assumptions about the population distribution 2. Hypotheses: a. Null hypothesis HO: use “=” b. Alternative hypothesis Ha: use either “>”, “<” or “≠” 3. Test statistic: 4. Distribution of the test statistic under H0: z-distribution 5. a. The Rejection Region: defined by significance level alpha Or b. The P-value: depends on the test statistic and the operator used in Ha 6. Decision: a. If the test statistic is in the rejection region reject H0 at the α level of significance. Otherwise fail to reject H0. b. If P-value is less than the significance level alpha reject H0 at the α level of significance. Otherwise fail to reject H0. Example: Two-Tailed z Test Does an average box of cereal contain 368 grams of cereal? A random sample of 40 boxes had ̅ = 372.5. The company has specified s to be 25 grams. Test at the .05 level of significance a. State the parameter of interest and check if the assumptions are met. Answer: the mean amount of cereal in a box of cereal: µ ………………………………………….. b. Give the null and alternative hypotheses H0: ………. Ha: …………….. Form of the test (left/right/two tails). c. Collect and label the information x-bar=……………… s = ………………n=…………... 4 of 13 STT315 Chapter 7 Inferences – Single Sample d. Write the formula for the test statistic and find the observed value of the test statistic Test statistic ……………………The observed value of the test statistic………….. e. Give the rejection region using α = .05. Ans. …………………………………………… f. Draw the rejection region and mark the value of the test statistics on the graph g. Find P-value, compare with the significance level alpha h. State the appropriate conclusion for the hypothesis test One-Tailed z Test Example Does an average box of cereal contain more than 368 grams of cereal? A random sample of 40 boxes showed ̅ = 372.5. The company has specified s to be 25 grams. Test at the .05 level of significance. Exercise: 7.28 Consider the test H 0 : μ = 70 versus H a : μ > 70 using a large sample of size n = 400 . Assume σ = 20. a. Describe the sampling distribution of x ¯ . b. Find the value of the test statistic if x ¯ = 72.5 . c. Refer to part b. Find the p-value of the test. d. Find the rejection region of the test for α = .01 . e. Use the p-value approach to make the appropriate conclusion. f. Repeat part e, but use the rejection region approach. g. Do the conclusions, parts e and f, agree? 5 of 13 STT315 Chapter 7 Inferences – Single Sample 7.5 Test of Hypothesis about a Population Mean μ: Student’s t-Statistic This section deals with the case when the sample size is small and σ is not known. We must assume that the population is normal. Small-Sample Test of Hypothesis about a Population Mean μ 1. Assumptions: a. Random sample b. Small sample size c. Population distribution is normal d. Population standard deviation σ is not known 2. Hypotheses: a. Null hypothesis HO: µ= c b. Alternative hypothesis Ha: µ> c or Ha: µ< c or Ha: µ≠ c 3. Test statistic: t x s/ n 4. Distribution of the test statistic under H0: t-distribution with df = n-1 6. Conclusions: a. If the observed value of the test statistic falls in the rejection region, reject H0 at the α level of significance. b. If the observed value of the test statistic does not fall in the rejection region, do not reject H0. The data do not provide sufficient evidence to reject H0 at the α level of significance. 6 of 13 STT315 Chapter 7 Inferences – Single Sample 7. P-value – computation depends on the form of an alternative hypothesis. If we denote the observed value of the test statistic by tobserved, then Ha: µ> 0 p-value = P(t > tobs ) Ha: µ< 0 p-value = P(t < tobs) Ha:µ ≠ 0 p-value = P(|t| >|tobs|) (Make a sketch for each situation above) REMARKS: 1. If σ is known and the population is normal, then use the z-test statistic (which under H0 has the standard normal distribution). The rejection region and the p-value are computed from z-distribution 2. If the sample size n is small, and the population distribution is NOT normal, then the methods developed in this chapter cannot be used. Exercise Does an average box of cereal contain 368 grams of cereal? A random sample of 25 boxes had a mean of 372.5 and a standard deviation of 12 grams. Test at the .05 level of significance a. State the parameter of interest. Ans. ……………… . b. Give the null and alternative hypotheses H0: ………. Ha: …………….. c. Find sample mean and sample standard deviation x-bar= ……… s = …….. d. Find the observed value of the proper test statistic …………………………….. e. Give and graph the rejection region at α= .01 Ans. ……………………………… f. State the conclusion for the hypothesis test ………………………………………………… g. Compute and graph the p-value for this test. P-value = ………………. h. Repeat the test using TI-83 [STAT → TEST → 2:T-Test] 7 of 13 STT315 Chapter 7 Inferences – Single Sample Exercise 2 [7.50, p.384] A sample of five measurements was taken from a normally distributed population. Sample statistics are x-bar=4.8 and s=1.3 a. Test the null hypothesis that the mean of the population is 6 against the alternative hypothesis, μ < 6, at a significance level α = .05. Use the rejection region method . Answer all parts observed value of the test statistics ……………………….. rejection region ……………………………………………. conclusion at α = .05 ……………………………………….. b. Test the null hypothesis that the mean of the population is 6 against the alternative hypothesis, μ ≠6. at a significance level α = .05. Use the rejection region method . Answer all parts observed value of the test statistics ……………………….. rejection region ……………………………………………. conclusion at α = .05 ……………………………………….. c. Find the observed significance level (p-value) for each test. Use a calculator or software. Then repeat parts a. and b. using the p-value method. Test a: p-value …………………….., conclusion ……………………….. Test b: p-value …………………….., conclusion ……………………….. 6.6 Large-Sample Test of Hypothesis about a Population Proportion p NOTE: This implies that for large n, a binomial distribution with parameters n and p (i.e. the distribution of the number of successes x = in the sample) is approximately normal with mean and standard deviation as above. Test of Hypothesis about a Population Proportion p 1. Assumptions: a. Random sample b. Large sample size, both np0 ≥ 15 and nq0 ≥ 15, where q0 = 1-p0 8 of 13 STT315 Chapter 7 Inferences – Single Sample 2. Hypotheses: a. Null hypothesis HO: p = p0 b. Alternative hypothesis Ha: p > p0 or Ha: p < p0 or Ha: p ≠ p0 3. Test statistic: where q0 = 1 - p0 4. Distribution of the test statistic under H0: standard normal (z-distribution) 5. Rejection region - depends on the form of an alternative hypothesis and the significance level α: 6. Conclusions: a. If the calculated test statistic falls in the rejection region, reject H0 and support Ha. b. If the test statistic does not fall in the rejection region, uphold H0. State that the sampling experiment does not provide sufficient evidence to reject H0 at the α level of significance. 7. P-value – computation depends on the form of an alternative hypothesis. If we denote the observed value of the test statistic by zobs, then 9 of 13 STT315 Chapter 7 Inferences – Single Sample 8. Decision Rule based on the p-value. Given a significance level α if p-value < α, then reject HO at the significance level α if p-value ≥ α, then don’t reject HO at the level α (Finally, refer to the stated claim and either support or don’t support it). Exercise [ 7.64, page 391] Suppose a random sample of 100 observations from a binomial population (= population with unknown proportion p of items of some type) gives a value of p-hat = .63 and you wish to test the null hypothesis that the population parameter p is equal to .70 against the alternative hypothesis that p is less than .70. Use large sample z-test a. Write the null and alternative hypotheses, H0: ………. Ha: …………….. b. Give and graph the rejection region at α= .05. Ans. ……………… c. Find the observed value of the test statistic. Ans. ……………… d. State the conclusion for the hypothesis test. Ans. ……………… e. Find and interpret the observed significance level (p-value) of the test you conducted. Ans. p-value = …………….. f. Repeat part e using TI-83 [STAT → TEST → 5:1-PropZTest] Exercise: You’re an accounting manager. A year-end audit showed 4% of transactions had errors. You implement new procedures. A random sample of 500 transactions had 25 errors. Has the proportion of incorrect transactions changed at the .05 level of significance? a. Calculate a point estimate for p. ……………… b. Set up the null and alternative hypotheses to test this claim. H0: ………. Ha: …………….. c. Calculate the test statistic for the test. Ans. ………………. d. Find the rejection region for the test if α= .05. Ans. ……………… 10 of 13 STT315 Chapter 7 Inferences – Single Sample e. Make the appropriate conclusion. Ans. ……………… Use TI-83 to find the p-value and repeat part e. Ans. p-value = …………….. Exercise: 7.70 Satellite radio in cars. A spokesperson for the National Association of Broadcasters (NAB) claims that 80% of all satellite radio subscribers have a satellite radio receiver in their car. In a recent survey of 501 satellite radio subscribers, 396 have a satellite receiver in their car. Consider a test of the NAB spokesperson's claim. a. Define the parameter of interest to the NAB spokesperson. b. Set up the null hypothesis for testing the claim. c. Specify the alternative hypothesis if you believe that the spokesperson's claim is too high. d. Compute the value of the test statistic. e. Determine the rejection region for the test using α = .10 . f. Compute the p-value of the test. g. Make the appropriate conclusion. Show that the decision based on the rejection region agrees with the decision based on the p-value. 11 of 13 Chapter 7 Inferences – Single Sample STT315 Additional Exercises – use TI-83/84 to solve problems Ch. 6-7 Summary: Which option to use on TI-83? Parameter σ Sampl Population e Size Conf. Int. Test Large Any Known or unknown Small Normal Known Z-Interval Z-Test Small Normal Unknown T-Interval T-Test N/A N/A 1-PropZTest Mean µ Proportion p Large Z-Interval Z-Test 1-PropZInt Exercises: Solve the following problems using TI-83. State any assumptions that you need to make. 1. Of 346 items tested, 16 are found to be defective. Construct a 98% confidence interval for the percentage of all such items that are defective. 2. Is the mean lifetime of particular type of car engine different than 220,000 miles? To test this claim, a sample of 23 engines is measured, yielding an average of 226,450 miles and a standard deviation of 11,500 miles. Use a significance level of 0.01. 3. A sociologist develops a test to measure attitudes about public transportation, and 55 randomly selected subjects are given the test. Their mean score is 76.2 and their standard deviation is 21.4. Construct the 95% confidence interval for the mean score of all such subjects. 4. The U.S. Department of Labor and Statistics released the current unemployment rate of 15.3% for the month in the U.S. and claims the unemployment has not changed in the last two months. However, the states statistics reveal that there is a decrease in the U.S. unemployment rate. A test on unemployment was done on a random sample size of 1000 and found unemployment at 13.8%. Test an appropriate hypothesis and state your conclusion. Use a significance level of 0.05. 5. A state university wants to increase its retention rate of 4% for graduating students from the previous year. After implementing several new programs 12 of 13 STT315 Chapter 7 Inferences – Single Sample during the last two years, the university reevaluated its retention rate using a random sample of 360 students and found the retention rate at 5%. Test an appropriate hypothesis and state your conclusion. Use a significance level of 0.02. 6. The principal randomly selected six students to take an aptitude test. Their scores were: 83.9 73.7 82.1 88.5 87.2 83.3 Determine a 90% confidence interval for the mean score for all students in the school 7. Solve the previous problem assuming that the standard deviation of this aptitude test is known to be σ = 4.8 13 of 13


