SROI Guide Impact Map for worked example
advertisement
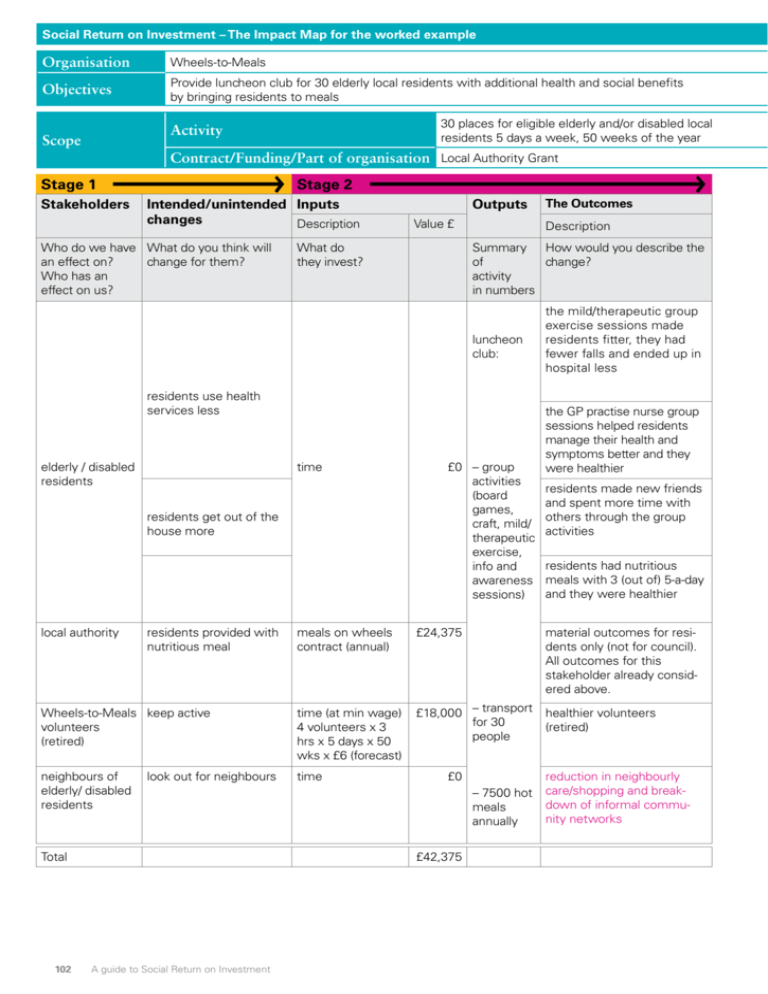
Social Return on Investment – The Impact Map for the worked example Organisation Wheels-to-Meals Objectives Provide luncheon club for 30 elderly local residents with additional health and social benefits by bringing residents to meals 30 places for eligible elderly and/or disabled local residents 5 days a week, 50 weeks of the year Activity Scope Contract/Funding/Part of organisation Local Authority Grant Stage 1 Stakeholders Stage 2 Intended/unintended Inputs changes Description Who do we have What do you think will an effect on? change for them? Who has an effect on us? Outputs Value £ What do they invest? Description Summary How would you describe the of change? activity in numbers luncheon club: residents use health services less elderly / disabled residents time residents get out of the house more local authority residents provided with nutritious meal The Outcomes £0 – group activities (board games, craft, mild/ therapeutic exercise, info and awareness sessions) the mild/therapeutic group exercise sessions made residents fitter, they had fewer falls and ended up in hospital less the GP practise nurse group sessions helped residents manage their health and symptoms better and they were healthier residents made new friends and spent more time with others through the group activities residents had nutritious meals with 3 (out of) 5-a-day and they were healthier meals on wheels contract (annual) £24,375 Wheels-to-Meals keep active volunteers (retired) time (at min wage) 4 volunteers x 3 hrs x 5 days x 50 wks x £6 (forecast) £18,000 – transport healthier volunteers for 30 (retired) people neighbours of elderly/ disabled residents time look out for neighbours Total 102 £0 – 7500 hot meals annually £42,375 A guide to Social Return on Investment material outcomes for residents only (not for council). All outcomes for this stakeholder already considered above. reduction in neighbourly care/shopping and breakdown of informal community networks (continues on the next page) Name Date Objective of Activity Time Period 1 year (2010) Purpose of Analysis Forecast or Evaluation Forecast Stage 3 The Outcomes (what changes) Indicator Source Quantity How would you measure it? Where did you get the information from? fewer falls and associated hospital admissions/stays annually oneoff research fewer GP visits annually (appointments) and residents report improvement in physical health Duration Financial proxy Value £ Source How much How change long was there? does it last? What proxy would you use to value the change? What is the value of the change? Where did you get the information from? 7 1 year accident&emergency 1 year geriatric assessment inpatient £94.00 NHS cost £4,964.00 book 07/08 1 year geriatric continuing care-Inpatient (average 5 wks x £1,444) £7,220.00 questionaire and interviews 90 5 years GP consultation £19.00 NHS cost book 2006 new clubs/group activities questionaire joined during year and residents report an increase in personal wellbeing/ feeling less isolated 16 1 year average annual membership/cost £48.25 current average costs of bus trips, bingo and craft clubs fewer District Nurse visits and residents reporting increased physical activity of 3 hours or more a week 14 2 years District Nurse visits £34.00 NHS cost book 07/08 volunteers report increased volunteer anphysical activity of 3 hours nual assessor more a week since ment volunteering 4 1 year annual elderly residents swimming pass fewer instances of neighbours shopping for residents annually 275 3 years supermarket online shopping delivery fee questionaire Oneoff survey £162.50 local authority - £5.00 www.tesco. co.uk A guide to Social Return on Investment 103 Social Return on Investment – The Impact Map for the worked example (continued from previous page) Organisation Wheels-to-Meals Objectives Provide luncheon club for 30 elderly local residents with additional health and social benefits by bringing residents to meals Scope 30 places for eligible elderly and/or disabled local residents 5 days a week, 50 weeks of the year Activity Contract/Funding/Part of organisation Local Authority Grant Stage 1 duplicate Stage 2 duplicate Stage 4 Stakeholders The outcomes Deadweight Attribution Drop Off Description % % How would you describe the change? What would Who else have happened contibuted to without the the change? activity? Does the outcome drop off in future years? the mild/therapeutic group exercise sessions made residents fitter, they had fewer falls and ended up in hospital less 0% 50% the GP practise nurse group sessions helped residents manage their health and symptoms better and they were healthier 0% 10% 10% residents made new friends and spent more time with others through the group activities 10% 35% 0% £451.62 residents had nutritious meals with 3 (out of) 5-a-day and they were healthier 100% 0% 0% £0.00 Groups of people that change as a result of the activity elderly / disabled residents 5% % £625.10 £48,013.00 material outcomes for residents only (not for council). All outcomes for this stakeholder already considered above. Wheels-toMeals volunteers (retired) healthier volunteers (retired) 70% 10% 35% neighbours of elderly/ disabled residents reduction in neighbourly care/shopping and breakdown of informal community networks 5% 0% 5% 104 Quantity times financial proxy, less deadweight, displacement and attribution £33,010.60 local authority Total Impact £1,539.00 £0.00 £175.50 -£1,306.25 £82,508.57 Name Date Objective of Activity Time Period 1 year (2010) Purpose of Analysis Forecast or Evaluation Forecast Stage 5 Calculating Social Return Discount rate (%) Year 1 Year 2 Year 3 Year 4 Year 5 £625.10 £0.00 £0.00 £0.00 £0.00 £33,010.60 £0.00 £0.00 £0.00 £0.00 £48,013.00 £0.00 £0.00 £0.00 £0.00 £1,539.00 £1,385.10 £1,246.59 £1,121.93 £1,009.74 £451.62 £0.00 £0.00 £0.00 £0.00 £0.00 £0.00 £0.00 £0.00 £0.00 £0.00 £0.00 £0.00 £0.00 £0.00 £175.50 £0.00 £0.00 £0.00 £0.00 -£1,306.25 -£1,240.94 -£1,178.89 £0.00 £0.00 £82,508.57 £144.16 £67.70 £1,121.93 £1,009.74 £79,718.43 £134.58 £61.06 £977.70 £850.17 (after activity) Present Value* 3.5% Total Present Value (PV) £81,741.93 Net Present Value £39,366.93 Social Return £ per £ £1.93: £1 * See page 68 for an explanation of these calculations 105
