advertisement
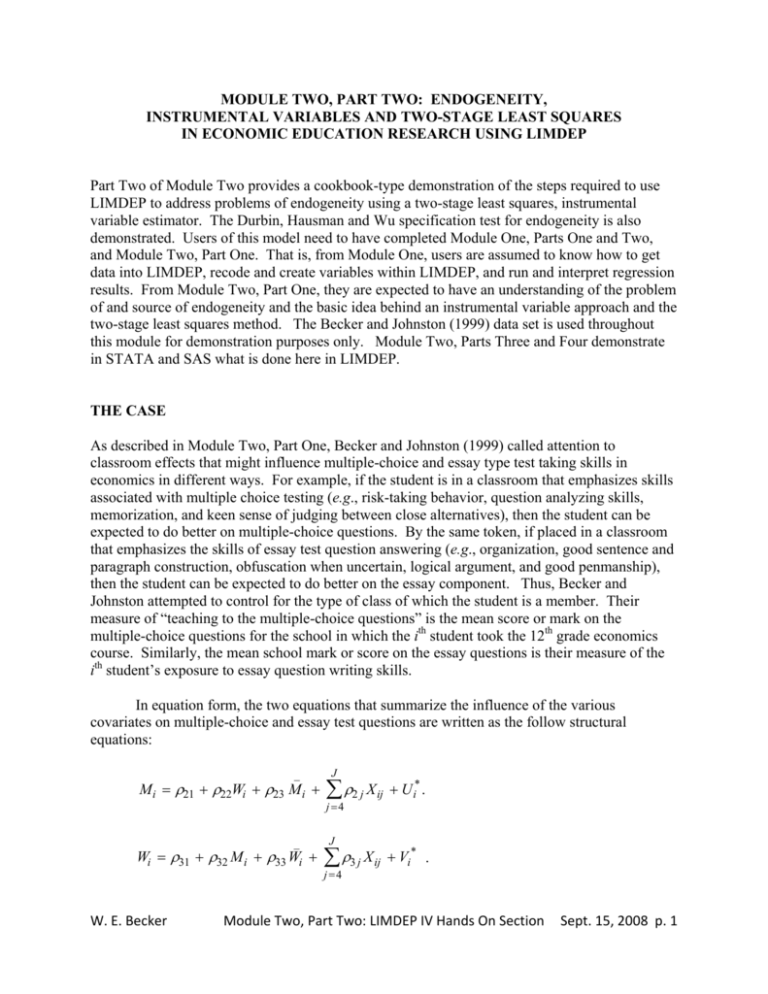
MODULE TWO, PART TWO: ENDOGENEITY, INSTRUMENTAL VARIABLES AND TWO-STAGE LEAST SQUARES IN ECONOMIC EDUCATION RESEARCH USING LIMDEP Part Two of Module Two provides a cookbook-type demonstration of the steps required to use LIMDEP to address problems of endogeneity using a two-stage least squares, instrumental variable estimator. The Durbin, Hausman and Wu specification test for endogeneity is also demonstrated. Users of this model need to have completed Module One, Parts One and Two, and Module Two, Part One. That is, from Module One, users are assumed to know how to get data into LIMDEP, recode and create variables within LIMDEP, and run and interpret regression results. From Module Two, Part One, they are expected to have an understanding of the problem of and source of endogeneity and the basic idea behind an instrumental variable approach and the two-stage least squares method. The Becker and Johnston (1999) data set is used throughout this module for demonstration purposes only. Module Two, Parts Three and Four demonstrate in STATA and SAS what is done here in LIMDEP. THE CASE As described in Module Two, Part One, Becker and Johnston (1999) called attention to classroom effects that might influence multiple-choice and essay type test taking skills in economics in different ways. For example, if the student is in a classroom that emphasizes skills associated with multiple choice testing (e.g., risk-taking behavior, question analyzing skills, memorization, and keen sense of judging between close alternatives), then the student can be expected to do better on multiple-choice questions. By the same token, if placed in a classroom that emphasizes the skills of essay test question answering (e.g., organization, good sentence and paragraph construction, obfuscation when uncertain, logical argument, and good penmanship), then the student can be expected to do better on the essay component. Thus, Becker and Johnston attempted to control for the type of class of which the student is a member. Their measure of “teaching to the multiple-choice questions” is the mean score or mark on the multiple-choice questions for the school in which the ith student took the 12th grade economics course. Similarly, the mean school mark or score on the essay questions is their measure of the ith student’s exposure to essay question writing skills. In equation form, the two equations that summarize the influence of the various covariates on multiple-choice and essay test questions are written as the follow structural equations: _ M i = ρ21 + ρ22Wi + ρ23 M i + _ Wi = ρ31 + ρ32 M i + ρ33 Wi + W. E. Becker J ∑ ρ2 j X ij + U i* . j =4 J ∑ ρ3 j X ij + Vi* . j=4 Module Two, Part Two: LIMDEP IV Hands On Section Sept. 15, 2008 p. 1 M i and Wi are the ith student’s respective scores on the multiple-choice test and essay test. M i and Wi are the mean multiple-choice and essay test scores at the school where the ith student took the 12th grade economics course. The X i j variables are the other exogenous variables (such as gender, age, English a second language, etc.) used to explain the ith student’s multiple-choice and essay marks, where the ρs are parameters to be estimated. The inclusion of the mean multiple-choice and mean essay test scores in their respective structural equations, and their exclusion from the other equation, enables both of the structural equations to be identified within the system. As shown in Module Two, Part One, the least squares estimation of the ρs involves bias because the error term U i* is related to Wi, in the first equation, and Vi* is related to Mi, in second equation. Instruments for regressors Wi and Mi are needed. Because the reduced form equations express Wi and Mi solely in terms of exogenous variables, they can be used to generate the respective instruments: _ J _ ∑ Γ2 j X ij + U i** . M i = Γ21 + Γ22 W i + Γ23 M i + _ _ Wi = Γ31 + Γ32 M i + Γ33 Wi + j=4 J ∑ Γ3 j X ij + Vi** . j =4 The reduced form parameters (Γs) are functions of the ρs, and the reduced form error terms U** and V** are functions of U* and V*, which are not related to any of the regressors in the reduced form equations. We could estimate the reduced form equations and get Mˆ i and Wˆi . We could then substitute Mˆ i and Wˆi into the structural equations as proxy regressors (instruments) for M i and Wi . The least squares regression of Mi on Wˆi , M i and the Xs and a least squares regression of Wi on Mˆ i , Wi and the Xs would yield consistent estimates of the respective ρs, but the standard errors would be incorrect. LIMDEP automatically does all the required estimations with the two-stage, least squares command: 2SLS; LHS= ; RHS= ; INST= $ TWO-STAGE, LEAST SQUARES IN LIMDEP The Becker and Johnston (1999) data are in the file named “Bill.CSV.” Before reading these data into LIMDEP, however, the “Project Settings” must be increased from 200000 cells (222 W. E. Becker Module Two, Part Two: LIMDEP IV Hands On Section Sept. 15, 2008 p. 2 rows and 900 columns) to accommodate the 4,178 observations. This can be done with a project setting of 4000000 cells (4444 rows and 900 columns), following the procedures described in Module One, Part Two. After increasing the project setting, file Bill.CSV can be read into LIMDEP with the following read command (the file may be located anywhere on your hard drive but here it is located on the e drive): READ; NREC=4178; NVAR=44; FILE=e:\bill.csv; Names= student,school,size,other,birthday,sex,eslflag,adultst, mc1,mc2,mc3,mc4,mc5,mc6,mc7,mc8,mc9,mc10,mc11,mc12,mc13, mc14,mc15,mc16,mc17,mc18,mc19,mc20,totalmc,avgmc, essay1,essay2,essay3,essay4,totessay,avgessay, totscore,avgscore,ma081,ma082,ec011,ec012,ma083,en093$ Using these recode and create commands, yields the following relevant variable definitions: recode; size; 0/9=1; 10/19=2; 20/29=3; 30/39=4; 40/49=5; 50/100=6$ create; smallest=size=1; smaller=size=2; small=size=3; large=size=4; larger=size=5; largest=size=6$ TOTALMC: Student’s score on 12th grade economics multiple-choice exam ( M i ). AVGMC: Mean multiple-choice score for students at school ( M i ). TOTESSAY: Student’s score on 12th grade economics essay exam ( Wi ). AVGESSAY: Mean essay score for students at school ( Wi ). ADULTST = 1, if a returning adult student, and 0 otherwise. SEX = GENDER = 1 if student is female and 0 is male. ESLFLAG = 1 if English is not student’s first language and 0 if it is. EC011 = 1 if student enrolled in first semester 11 grade economics course, 0 if not. EN093 = 1 if student was enrolled in ESL English course, 0 if not MA081 = 1 if student enrolled in the first semester 11 grade math course, 0 if not. MA082 = 1 if student was enrolled in the second semester 11 grade math course, 0 if not. MA083 = 1 if student was enrolled in the first semester 12 grade math course, 0 if not. SMALLER = 1 if student from a school with 10 to 19 test takers, 0 if not. SMALL = 1 if student from a school with 20 to 29 test takers, 0 if not. LARGE = 1 if student from a school with 30 to 39 test takers, 0 if not. LARGER = 1 if student from a school with 40 to 49 test takers, 0 if not. In all of the regressions, the effect of being at a school with more than 49 test takers is captured in the constant term, against which the other dummy variables are compared. The smallest schools need to be rejected to treat the mean scores as exogenous and unaffected by any individual student’s test performance, which is accomplished with the following command: Reject; smallest = 1$ W. E. Becker Module Two, Part Two: LIMDEP IV Hands On Section Sept. 15, 2008 p. 3 The descriptive statistics on the relevant variables are then obtained with the following command, yielding the LIMDEP output table shown: Dstat;RHS=TOTALMC,AVGMC,TOTESSAY,AVGESSAY,ADULTST,SEX,ESLFLAG, EC01,EN093,MA081,MA082,MA083,SMALLER,SMALL,LARGE,LARGER$ Descriptive Statistics All results based on nonmissing observations. =============================================================================== Variable Mean Std.Dev. Minimum Maximum Cases =============================================================================== ------------------------------------------------------------------------------All observations in current sample ------------------------------------------------------------------------------TOTALMC 12.4355795 3.96194160 .000000000 20.0000000 3710 AVGMC 12.4355800 1.97263767 6.41666700 17.0714300 3710 TOTESSAY 18.1380054 9.21191366 .000000000 40.0000000 3710 AVGESSAY 18.1380059 4.66807071 5.70000000 29.7857100 3710 ADULTST .512129380E-02 .713893539E-01 .000000000 1.00000000 3710 SEX .390566038 .487943012 .000000000 1.00000000 3710 ESLFLAG .641509434E-01 .245054660 .000000000 1.00000000 3710 EC011 .677088949 .467652064 .000000000 1.00000000 3710 EN093 .622641509E-01 .241667268 .000000000 1.00000000 3710 MA081 .591374663 .491646035 .000000000 1.00000000 3710 MA082 .548787062 .497681208 .000000000 1.00000000 3710 MA083 .420215633 .493659946 .000000000 1.00000000 3710 SMALLER .462264151 .498641179 .000000000 1.00000000 3710 SMALL .207277628 .405410797 .000000000 1.00000000 3710 LARGE .106469003 .308478530 .000000000 1.00000000 3710 LARGER .978436658E-01 .297143201 .000000000 1.00000000 3710 For comparison with the two-stage least squares results, we start with the least squares regressions shown after this paragraph. The least squares estimations are typical of those found in multiple-choice and essay score correlation studies, with correlation coefficients of 0.77 and 0.78. The essay mark or score, W, is the most significant variable in the multiple-choice score regression (first of the two tables) and the multiple-choice mark, M, is the most significant variable in the essay regression (second of the two tables). Results like these have led researchers to conclude that the essay and multiple-choice marks are good predictors of each other. Notice also that both the mean multiple-choice and mean essay marks are significant in their respective equations, suggesting that something in the classroom environment or group experience influences individual test scores. Finally, being female has a significant negative effect on the multiple choice-test score, but a significant positive effect on the essay score, as expected from the least squares results reported by others. We will see how these results hold up in the two-stage least squares regressions. Regress;LHS=TOTALMC;RHS=TOTESSAY,ONE,ADULTST,SEX,AVGMC, ESLFLAG,EC011,EN093,MA081,MA082,MA083,SMALLER,SMALL,LARGE,LARGER$ +-----------------------------------------------------------------------+ | Ordinary least squares regression Weighting variable = none | | Dep. var. = TOTALMC Mean= 12.43557951 , S.D.= 3.961941603 | | Model size: Observations = 3710, Parameters = 15, Deg.Fr.= 3695 | | Residuals: Sum of squares= 23835.89955 , Std.Dev.= 2.53985 | | Fit: R-squared= .590590, Adjusted R-squared = .58904 | | Model test: F[ 14, 3695] = 380.73, Prob value = .00000 | | Diagnostic: Log-L = -8714.8606, Restricted(b=0) Log-L = -10371.4459 | | LogAmemiyaPrCrt.= 1.868, Akaike Info. Crt.= 4.706 | | Autocorrel: Durbin-Watson Statistic = 1.99019, Rho = .00490 | W. E. Becker Module Two, Part Two: LIMDEP IV Hands On Section Sept. 15, 2008 p. 4 +-----------------------------------------------------------------------+ +---------+--------------+----------------+--------+---------+----------+ |Variable | Coefficient | Standard Error |b/St.Er.|P[|Z|>z] | Mean of X| +---------+--------------+----------------+--------+---------+----------+ TOTESSAY .2707916883 .54725877E-02 49.481 .0000 18.138005 Constant 2.654956801 .33936151 7.823 .0000 ADULTST .4674947703 .59221296 .789 .4299 .51212938E-02 SEX -.5259548390 .91287080E-01 -5.762 .0000 .39056604 AVGMC .3793818833 .25290373E-01 15.001 .0000 12.435580 ESLFLAG .3933259495 .85245570 .461 .6445 .64150943E-01 EC011 .1722643321E-01 .92648817E-01 .186 .8525 .67708895 EN093 -.3117337847 .86493864 -.360 .7185 .62264151E-01 MA081 -.1208070545 .18084020 -.668 .5041 .59137466 MA082 .3827058262 .19467371 1.966 .0493 .54878706 MA083 .3703758129 .11847674 3.126 .0018 .42021563 SMALLER .6721051012E-01 .14743497 .456 .6485 .46226415 SMALL -.5687831831E-02 .15706323 -.036 .9711 .20727763 LARGE .6635816769E-01 .17852633 .372 .7101 .10646900 LARGER .5654860817E-01 .18217561 .310 .7563 .97843666E-01 (Note: E+nn or E-nn means multiply by 10 to + or -nn power.) Regress;LHS=TOTESSAY;RHS=TOTALMC,ONE, ADULTST,SEX,AVGESSAY, ESLFLAG,EC011,EN093,MA081,MA082,MA083,SMALLER,SMALL,LARGE,LARGER$ +-----------------------------------------------------------------------+ | Ordinary least squares regression Weighting variable = none | | Dep. var. = TOTESSAY Mean= 18.13800539 , S.D.= 9.211913659 | | Model size: Observations = 3710, Parameters = 15, Deg.Fr.= 3695 | | Residuals: Sum of squares= 123011.3151 , Std.Dev.= 5.76986 | | Fit: R-squared= .609169, Adjusted R-squared = .60769 | | Model test: F[ 14, 3695] = 411.37, Prob value = .00000 | | Diagnostic: Log-L = -11759.0705, Restricted(b=0) Log-L = -13501.8081 | | LogAmemiyaPrCrt.= 3.509, Akaike Info. Crt.= 6.347 | | Autocorrel: Durbin-Watson Statistic = 2.03115, Rho = -.01557 | +-----------------------------------------------------------------------+ +---------+--------------+----------------+--------+---------+----------+ |Variable | Coefficient | Standard Error |b/St.Er.|P[|Z|>z] | Mean of X| +---------+--------------+----------------+--------+---------+----------+ TOTALMC 1.408895961 .28223608E-01 49.919 .0000 12.435580 Constant -8.948704180 .55427657 -16.145 .0000 ADULTST -.8291495512 1.3454556 -.616 .5377 .51212938E-02 SEX 1.239956900 .20801072 5.961 .0000 .39056604 AVGESSAY .4000235352 .23711680E-01 16.870 .0000 18.138006 ESLFLAG .4511403830 1.9369352 .233 .8158 .64150943E-01 EC011 .2985371912 .21044864 1.419 .1560 .67708895 EN093 -2.020881931 1.9647001 -1.029 .3037 .62264151E-01 MA081 .8495120566 .41061265 2.069 .0386 .59137466 MA082 .1590915478 .44249860 .360 .7192 .54878706 MA083 1.809541566 .26793945 6.754 .0000 .42021563 SMALLER .6170663022 .33054246 1.867 .0619 .46226415 SMALL .2693408755 .35476913 .759 .4477 .20727763 LARGE .2646447973 .40526280 .653 .5137 .10646900 LARGER .6150288712E-01 .41436703 .148 .8820 .97843666E-01 (Note: E+nn or E-nn means multiply by 10 to + or -nn power.) Theoretical considerations discussed in Module Two, Part One, suggest that these least squares estimates involve a simultaneous equation bias that is brought about by an apparent reverse causality between the two forms of testing. Consistent estimation of the parameters in this simultaneous equation system is possible with two-stage least squares, where our instrument ( Mˆ i ) for Mi is obtained by a least squares regression of Mi on SEX, ADULTST, AVGMC, AVGESSAY, ESLFLAG,SMALLER,SMALL, LARGE, LARGER, EC011, EN093, MA081, MA082, and MA083. Our instrument ( Wˆi ) for Wi is obtained by a least squares regression of W. E. Becker Module Two, Part Two: LIMDEP IV Hands On Section Sept. 15, 2008 p. 5 Wi on SEX, ADULTST, AVGMC, AVGESSAY, ESLFLAG, SMALLER, SMALL, LARGE, LARGER, EC011, EN093, MA081, MA082, and MA083. LIMDEP will do these regressions and the subsequent regressions for M and W employing these instruments via the following commands, which yield the subsequent output: i 2SLS; LHS = TOTALMC; RHS = TOTESSAY,ONE, ADULTST,SEX,AVGMC, ESLFLAG,EC011,EN093,MA081,MA082,MA083,SMALLER,SMALL,LARGE, LARGER; INST = ONE,SEX, ADULTST ,AVGMC,AVGESSAY,ESLFLAG, SMALLER,SMALL,LARGE,LARGER,EC011,EN093,MA081,MA082,MA083$ +-----------------------------------------------------------------------+ | Two stage least squares regression Weighting variable = none | | Dep. var. = TOTALMC Mean= 12.43557951 , S.D.= 3.961941603 | | Model size: Observations = 3710, Parameters = 15, Deg.Fr.= 3695 | | Residuals: Sum of squares= 46157.78754 , Std.Dev.= 3.53440 | | Fit: R-squared= .203966, Adjusted R-squared = .20095 | | (Note: Not using OLS. R-squared is not bounded in [0,1] | | Model test: F[ 14, 3695] = 67.63, Prob value = .00000 | | Diagnostic: Log-L = -9940.7797, Restricted(b=0) Log-L = -10371.4459 | | LogAmemiyaPrCrt.= 2.529, Akaike Info. Crt.= 5.367 | | Autocorrel: Durbin-Watson Statistic = 2.07829, Rho = -.03914 | +-----------------------------------------------------------------------+ +---------+--------------+----------------+--------+---------+----------+ |Variable | Coefficient | Standard Error |b/St.Er.|P[|Z|>z] | Mean of X| +---------+--------------+----------------+--------+---------+----------+ TOTESSAY -.5247790489E-01 .36407219E-01 -1.441 .1495 18.138005 Constant -.3038295700 .57375703 -.530 .5964 ADULTST .2533493567 .82444633 .307 .7586 .51212938E-02 SEX -.8971949978E-01 .13581404 -.661 .5089 .39056604 AVGMC .9748840572 .74429145E-01 13.098 .0000 12.435580 ESLFLAG .6744471036 1.1866603 .568 .5698 .64150943E-01 EC011 .2925430155 .13244518 2.209 .0272 .67708895 EN093 -1.588715660 1.2118154 -1.311 .1899 .62264151E-01 MA081 .2995655100 .25587578 1.171 .2417 .59137466 MA082 .8159710785 .27507326 2.966 .0030 .54878706 MA083 1.635255739 .21583992 7.576 .0000 .42021563 SMALLER .2715919941 .20639788 1.316 .1882 .46226415 SMALL .4372991271E-01 .21863306 .200 .8415 .20727763 LARGE .1981182700 .24885626 .796 .4260 .10646900 LARGER -.8677104536E-01 .25400196 -.342 .7326 .97843666E-01 2SLS; LHS = TOTESSAY; RHS = TOTALMC,ONE, ADULTST,SEX,AVGE SSAY,ESLFLAG,EC011,EN093,MA081,MA082,MA083,SMALLER,SMALL, LARGE,LARGER; INST = ONE,SEX, ADULTST,AVGMC,AVGESSAY,ESLFLAG, SMALLER,SMALL,LARGE,LARGER,EC011,EN093,MA081,MA082,MA083$ +-----------------------------------------------------------------------+ | Two stage least squares regression Weighting variable = none | | Dep. var. = TOTESSAY Mean= 18.13800539 , S.D.= 9.211913659 | | Model size: Observations = 3710, Parameters = 15, Deg.Fr.= 3695 | | Residuals: Sum of squares= 201898.9900 , Std.Dev.= 7.39196 | | Fit: R-squared= .355924, Adjusted R-squared = .35348 | | (Note: Not using OLS. R-squared is not bounded in [0,1] | | Model test: F[ 14, 3695] = 145.85, Prob value = .00000 | | Diagnostic: Log-L = -12678.2066, Restricted(b=0) Log-L = -13501.8081 | | LogAmemiyaPrCrt.= 4.005, Akaike Info. Crt.= 6.843 | | Autocorrel: Durbin-Watson Statistic = 2.10160, Rho = -.05080 | +-----------------------------------------------------------------------+ +---------+--------------+----------------+--------+---------+----------+ |Variable | Coefficient | Standard Error |b/St.Er.|P[|Z|>z] | Mean of X| +---------+--------------+----------------+--------+---------+----------+ TOTALMC .2788777265E-01 .15799711 .177 .8599 12.435580 Constant -1.179740796 1.1193206 -1.054 .2919 ADULTST -.1690793751 1.7252757 -.098 .9219 .51212938E-02 W. E. Becker Module Two, Part Two: LIMDEP IV Hands On Section Sept. 15, 2008 p. 6 SEX .6854633662 AVGESSAY .8417622152 ESLFLAG 1.723698602 EC011 .7128702679 EN093 -3.983249481 MA081 1.069628788 MA082 1.217026971 MA083 3.892551120 SMALLER .3348223746 SMALL -.1364832691 LARGE .3418924354 LARGER -.8251220287E-01 .27355130 .57819872E-01 2.4855173 .27353325 2.5265144 .52662071 .57901457 .41430603 .42463421 .45674848 .51926721 .53110191 2.506 14.558 .693 2.606 -1.577 2.031 2.102 9.395 .788 -.299 .658 -.155 .0122 .0000 .4880 .0092 .1149 .0422 .0356 .0000 .4304 .7651 .5103 .8765 .39056604 18.138006 .64150943E-01 .67708895 .62264151E-01 .59137466 .54878706 .42021563 .46226415 .20727763 .10646900 .97843666E-01 The 2SLS results differ from the least squares results in many ways. The essay mark or score, W, is no longer a significant variable in the multiple-choice regression and the multiplechoice mark, M, is likewise insignificant in the essay regression. Each score appears to be measuring something different when the regressor and error-term-induced bias is eliminated by our instrumental variable estimators. Both the mean multiple-choice and mean essay scores continue to be significant in their respective equations. But now being female is insignificant in explaining the multiple-choice test score. Being female continues to have a significant positive effect on the essay score. DURBIN, HAUSMAN AND WU TEST FOR ENDOGENEITY The theoretical argument is strong for treating multiple-choice and essay scores as endogenous when employed as regressors in the explanation of the other. Nevertheless, this endogeneity can be tested with the Durbin, Hausman and Wu specification test, which is a two-step procedure in LIMDEP versions prior to 9. 0.4. ii Either a Wald statistic, in a Chi-square ( χ 2 ) test with K* degrees of freedom, or an F statistic with K* and n − (K + K*) degrees of freedom, is used to test the joint significance of the ˆ * ) of a regression of the K* endogenous regressors, in contribution of the predicted values ( X matrix X*, on the exogenous variables (and column of ones for the constant term) in matrix Z: ˆ * γ+ ε * , y = Xβ +X ˆ = Zλˆ , and λˆ is a least squares estimator of λ. where X* = Zλ + u , X* H o : γ = 0 , the variables in Z are exogenous H A : γ ≠ 0 , at least one of the variables in Z is endogenous In our case, K* = 1 when the essay score is to be tested as an endogenous regressor in the multiple-choice equation and when the multiple-choice regressor is to be tested as endogenous in the essay equation. X̂ * is an n × 1 vector of predicted essay scores from a regression of essay scores on all the exogenous variables (for subsequent use in the multiple-choice equation) or an n × 1 vector of predicted multiple-choice scores from a regression of multiple-choice scores on all the exogenous variables (for subsequent use in the essay equation). Because K* = 1, the relevant W. E. Becker Module Two, Part Two: LIMDEP IV Hands On Section Sept. 15, 2008 p. 7 test statistic is either the t, with n − (K + K*) degrees of freedom for small n or the standard normal, for large n. In LIMDEP, the predicted essay score is obtained by the following command, where the specification “;keep=Essayhat” tells LIMDEP to predict the essay scores and keep them as a variable called “Essayhat”: Regres; lhs= TOTESSAY; RHS= ONE,ADULTST,SEX, AVGESSAY,AVGMC, ESLFLAG,EC011,EN093,MA081,MA082,MA083,SMALLER,SMALL,LARGE,LARGER ;keep=Essayhat$ The predicted essay scores are then added as a regressor in the original multiple-choice regression: Regress;LHS=TOTALMC;RHS=TOTESSAY,ONE,ADULTST,SEX,AVGMC, ESLFLAG,EC011,EN093,MA081,MA082,MA083,SMALLER,SMALL,LARGE, LARGER, Essayhat$ The test statistic for the Essayhat coefficient is then used in the test of endogeneity. In the below LIMDEP output, we see that the calculated standard normal test statistic z value is −12.916, which far exceeds the absolute value of the 0.05 percent Type I error critical 1.96 standard normal value. Thus, the null hypothesis of an exogenous essay score as an explanatory variable for the multiple-choice score is rejected. As theorized, the essay score is endogenous in an explanation of the multiple-choice score. --> Regres; lhs= TOTESSAY; RHS= ONE,ADULTST,SEX, AVGESSAY,AVGMC, ESLFLAG,EC011,EN093,MA081,MA082,MA083,SMALLER,SMALL,LARGE,LARGER;keep=Esayhat$ +-----------------------------------------------------------------------+ | Ordinary least squares regression Weighting variable = none | | Dep. var. = TOTESSAY Mean= 18.13800539 , S.D.= 9.211913659 | | Model size: Observations = 3710, Parameters = 15, Deg.Fr.= 3695 | | Residuals: Sum of squares= 205968.5911 , Std.Dev.= 7.46609 | | Fit: R-squared= .345598, Adjusted R-squared = .34312 | | Model test: F[ 14, 3695] = 139.38, Prob value = .00000 | | Diagnostic: Log-L = -12715.2253, Restricted(b=0) Log-L = -13501.8081 | | LogAmemiyaPrCrt.= 4.025, Akaike Info. Crt.= 6.863 | | Autocorrel: Durbin-Watson Statistic = 2.10143, Rho = -.05072 | +-----------------------------------------------------------------------+ +---------+--------------+----------------+--------+---------+----------+ |Variable | Coefficient | Standard Error |b/St.Er.|P[|Z|>z] | Mean of X| +---------+--------------+----------------+--------+---------+----------+ Constant -1.186477526 1.1613927 -1.022 .3070 ADULTST -.1617772661 1.7412483 -.093 .9260 .51212938E-02 SEX .6819632415 .27234747 2.504 .0123 .39056604 AVGESSAY .8405321032 .64642750E-01 13.003 .0000 18.138006 AVGMC .2714761464E-01 .15534612 .175 .8613 12.435580 ESLFLAG 1.739961011 2.5067133 .694 .4876 .64150943E-01 EC011 .7199749635 .27219191 2.645 .0082 .67708895 EN093 -4.021669541 2.5417647 -1.582 .1136 .62264151E-01 MA081 1.076407689 .53146100 2.025 .0428 .59137466 MA082 1.237970826 .57190601 2.165 .0304 .54878706 MA083 3.932399725 .34253928 11.480 .0000 .42021563 SMALLER .3418961082 .43385196 .788 .4307 .46226415 SMALL -.1350660711 .46222353 -.292 .7701 .20727763 W. E. Becker Module Two, Part Two: LIMDEP IV Hands On Section Sept. 15, 2008 p. 8 LARGE .3469098130 .52477155 .661 .5086 .10646900 LARGER -.8480793833E-01 .53618108 -.158 .8743 .97843666E-01 (Note: E+nn or E-nn means multiply by 10 to + or -nn power.) --> Regress;LHS=TOTALMC;RHS=TOTESSAY,ONE,ADULTST,SEX,AVGMC, ESLFLAG,EC011,EN093,MA081,MA082,MA083,SMALLER,SMALL,LARGE,LARGER, Essayhat$ +-----------------------------------------------------------------------+ | Ordinary least squares regression Weighting variable = none | | Dep. var. = TOTALMC Mean= 12.43557951 , S.D.= 3.961941603 | | Model size: Observations = 3710, Parameters = 16, Deg.Fr.= 3694 | | Residuals: Sum of squares= 22805.95017 , Std.Dev.= 2.48471 | | Fit: R-squared= .608280, Adjusted R-squared = .60669 | | Model test: F[ 15, 3694] = 382.41, Prob value = .00000 | | Diagnostic: Log-L = -8632.9227, Restricted(b=0) Log-L = -10371.4459 | | LogAmemiyaPrCrt.= 1.825, Akaike Info. Crt.= 4.662 | | Autocorrel: Durbin-Watson Statistic = 2.07293, Rho = -.03647 | +-----------------------------------------------------------------------+ +---------+--------------+----------------+--------+---------+----------+ |Variable | Coefficient | Standard Error |b/St.Er.|P[|Z|>z] | Mean of X| +---------+--------------+----------------+--------+---------+----------+ TOTESSAY .2855834321 .54748868E-02 52.162 .0000 18.138005 Constant -.3038295700 .40335588 -.753 .4513 ADULTST .2533493567 .57959250 .437 .6620 .51212938E-02 SEX -.8971949978E-01 .95478380E-01 -.940 .3474 .39056604 AVGMC .9748840572 .52324297E-01 18.632 .0000 12.435580 ESLFLAG .6744471036 .83423185 .808 .4188 .64150943E-01 EC011 .2925430155 .93110045E-01 3.142 .0017 .67708895 EN093 -1.588715660 .85191616 -1.865 .0622 .62264151E-01 MA081 .2995655100 .17988277 1.665 .0958 .59137466 MA082 .8159710785 .19337874 4.220 .0000 .54878706 MA083 1.635255739 .15173722 10.777 .0000 .42021563 SMALLER .2715919941 .14509939 1.872 .0612 .46226415 SMALL .4372991270E-01 .15370083 .285 .7760 .20727763 LARGE .1981182700 .17494798 1.132 .2574 .10646900 LARGER -.8677104536E-01 .17856546 -.486 .6270 .97843666E-01 ESSAYHAT -.3380613370 .26173585E-01 -12.916 .0000 18.138005 (Note: E+nn or E-nn means multiply by 10 to + or -nn power.) The similar estimation routine to test for the endogeneity of the multiple-choice test score in the essay equation yields a calculated z test statistic of −11.713, which far exceeds the absolute value of its 1.96 critical value. Thus, the null hypothesis of an exogenous multiple-choice score as an explanatory variable for the essay score is rejected. As theorized, the multiple-choice score is endogenous in an explanation of the essay score. --> Regress;LHS=TOTALMC; RHS=ONE, ADULTST,SEX, AVGMC,AVGESSAY, ESLFLAG,EC011,EN093,MA081,MA082,MA083,SMALLER,SMALL,LARGE,LARGER; keep=MChat$ +-----------------------------------------------------------------------+ | Ordinary least squares regression Weighting variable = none | | Dep. var. = TOTALMC Mean= 12.43557951 , S.D.= 3.961941603 | | Model size: Observations = 3710, Parameters = 15, Deg.Fr.= 3695 | | Residuals: Sum of squares= 39604.31525 , Std.Dev.= 3.27389 | | Fit: R-squared= .319748, Adjusted R-squared = .31717 | | Model test: F[ 14, 3695] = 124.06, Prob value = .00000 | | Diagnostic: Log-L = -9656.7280, Restricted(b=0) Log-L = -10371.4459 | | LogAmemiyaPrCrt.= 2.376, Akaike Info. Crt.= 5.214 | | Autocorrel: Durbin-Watson Statistic = 2.07600, Rho = -.03800 | +-----------------------------------------------------------------------+ +---------+--------------+----------------+--------+---------+----------+ |Variable | Coefficient | Standard Error |b/St.Er.|P[|Z|>z] | Mean of X| +---------+--------------+----------------+--------+---------+----------+ W. E. Becker Module Two, Part Two: LIMDEP IV Hands On Section Sept. 15, 2008 p. 9 Constant -.2415657153 ADULTST .2618390887 SEX -.1255075019 AVGMC .9734594072 AVGESSAY -.4410936377E-01 ESLFLAG .5831375952 EC011 .2547602379 EN093 -1.377666868 MA081 .2430778897 MA082 .7510049632 MA083 1.428891640 SMALLER .2536500026 SMALL .5081789714E-01 LARGE .1799131698 LARGER -.8232050244E-01 .50927203 .76353941 .11942469 .68119457E-01 .28345921E-01 1.0991967 .11935647 1.1145668 .23304627 .25078145 .15020388 .19024459 .20268556 .23011294 .23511603 -.474 .343 -1.051 14.290 -1.556 .531 2.134 -1.236 1.043 2.995 9.513 1.333 .251 .782 -.350 .6353 .7317 .2933 .0000 .1197 .5958 .0328 .2164 .2969 .0027 .0000 .1824 .8020 .4343 .7262 .51212938E-02 .39056604 12.435580 18.138006 .64150943E-01 .67708895 .62264151E-01 .59137466 .54878706 .42021563 .46226415 .20727763 .10646900 .97843666E-01 --> Regress;LHS=TOTESSAY;RHS=TOTALMC,ONE, ADULTST,SEX,AVGESSAY, ESLFLAG,EC011,EN093,MA081,MA082,MA083,SMALLER,SMALL,LARGE,LARGER, MChat$ +-----------------------------------------------------------------------+ | Ordinary least squares regression Weighting variable = none | | Dep. var. = TOTESSAY Mean= 18.13800539 , S.D.= 9.211913659 | | Model size: Observations = 3710, Parameters = 16, Deg.Fr.= 3694 | | Residuals: Sum of squares= 118606.0003 , Std.Dev.= 5.66637 | | Fit: R-squared= .623166, Adjusted R-squared = .62164 | | Model test: F[ 15, 3694] = 407.25, Prob value = .00000 | | Diagnostic: Log-L = -11691.4200, Restricted(b=0) Log-L = -13501.8081 | | LogAmemiyaPrCrt.= 3.473, Akaike Info. Crt.= 6.311 | | Autocorrel: Durbin-Watson Statistic = 2.09836, Rho = -.04918 | +-----------------------------------------------------------------------+ +---------+--------------+----------------+--------+---------+----------+ |Variable | Coefficient | Standard Error |b/St.Er.|P[|Z|>z] | Mean of X| +---------+--------------+----------------+--------+---------+----------+ TOTALMC 1.485222426 .28473026E-01 52.162 .0000 12.435580 Constant -1.179740796 .85802415 -1.375 .1691 ADULTST -.1690793751 1.3225239 -.128 .8983 .51212938E-02 SEX .6854633662 .20969294 3.269 .0011 .39056604 AVGESSAY .8417622152 .44322287E-01 18.992 .0000 18.138006 ESLFLAG 1.723698602 1.9052933 .905 .3656 .64150943E-01 EC011 .7128702679 .20967911 3.400 .0007 .67708895 EN093 -3.983249481 1.9367199 -2.057 .0397 .62264151E-01 MA081 1.069628788 .40368533 2.650 .0081 .59137466 MA082 1.217026971 .44384827 2.742 .0061 .54878706 MA083 3.892551120 .31758961 12.257 .0000 .42021563 SMALLER .3348223746 .32550676 1.029 .3037 .46226415 SMALL -.1364832691 .35012421 -.390 .6967 .20727763 LARGE .3418924354 .39804844 .859 .3904 .10646900 LARGER -.8251220288E-01 .40712043 -.203 .8394 .97843666E-01 MCHAT -1.457334653 .12441585 -11.713 .0000 12.435580 (Note: E+nn or E-nn means multiply by 10 to + or -nn power.) CONCLUDING COMMENTS This cookbook-type introduction to the use of instrumental variables and two-stage least squares regression and testing for endogeneity has just scratched the surface of this controversial problem in statistical estimation and inference. It was intended to enable researchers to begin using instrumental variables in their work and to enable readers of that work to have an idea of what is being done. To learn more about these methods there is no substitute for a graduate level textbook treatment such as that found in William Greene’s Econometric Analysis. W. E. Becker Module Two, Part Two: LIMDEP IV Hands On Section Sept. 15, 2008 p. 10 REFERENCES Becker, William E. and Carol Johnston (1999).“The Relationship Between Multiple Choice and Essay Response Questions in Assessing Economics Understanding,” Economic Record (Economic Society of Australia), Vol. 75 (December): 348-357. Greene, William (2003). Econometric Analysis. 5th Edition, New Jersey: Prentice Hall. ENDNOTES i In the default mode, relatively large samples are required for 2SLS in LIMDEP because a routine aimed at providing consistent estimators is employed; thus, for example, no degrees of freedom adjustment is made for variances; i.e., σˆ 2 = (1 / n )∑ (i th prediction error ) 2 As William Greene states, “this is consistent with most published sources, but (curiously enough) inconsistent with most other commercially available computer programs.” The degrees of freedom correction for small samples is obtainable by adding the following specification to the 2SLS command: ;DFC ii In Limdep version 9.0.4, the following command will automatically test x3 for endogeneity: Regress; lhs=y; rhs=one,x2,x3; inst=one,x2,x4; Wu test$ Because x3 is not an instrument, LIMDEP knows the test for endogeneity is on this variable. W. E. Becker Module Two, Part Two: LIMDEP IV Hands On Section Sept. 15, 2008 p. 11


