Jigsaw meets Blue Iguanodon - The VAST 2007
advertisement
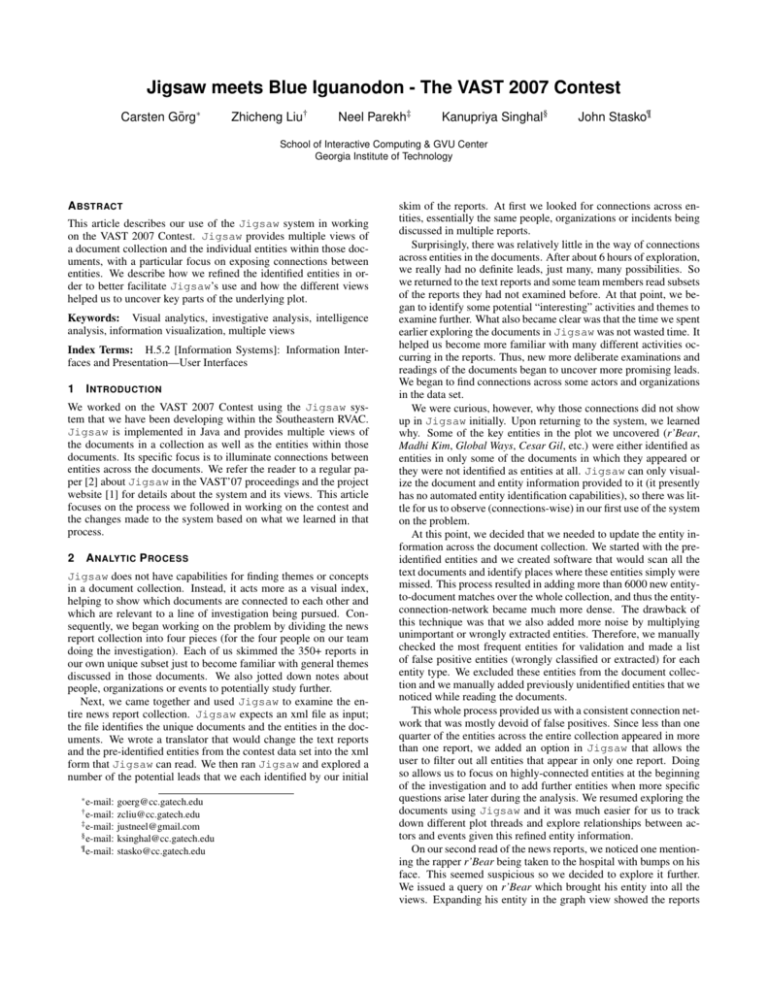
Jigsaw meets Blue Iguanodon - The VAST 2007 Contest Carsten Görg∗ Zhicheng Liu† Neel Parekh‡ Kanupriya Singhal§ John Stasko¶ School of Interactive Computing & GVU Center Georgia Institute of Technology A BSTRACT This article describes our use of the Jigsaw system in working on the VAST 2007 Contest. Jigsaw provides multiple views of a document collection and the individual entities within those documents, with a particular focus on exposing connections between entities. We describe how we refined the identified entities in order to better facilitate Jigsaw’s use and how the different views helped us to uncover key parts of the underlying plot. Keywords: Visual analytics, investigative analysis, intelligence analysis, information visualization, multiple views Index Terms: H.5.2 [Information Systems]: Information Interfaces and Presentation—User Interfaces 1 I NTRODUCTION We worked on the VAST 2007 Contest using the Jigsaw system that we have been developing within the Southeastern RVAC. Jigsaw is implemented in Java and provides multiple views of the documents in a collection as well as the entities within those documents. Its specific focus is to illuminate connections between entities across the documents. We refer the reader to a regular paper [2] about Jigsaw in the VAST’07 proceedings and the project website [1] for details about the system and its views. This article focuses on the process we followed in working on the contest and the changes made to the system based on what we learned in that process. 2 A NALYTIC P ROCESS Jigsaw does not have capabilities for finding themes or concepts in a document collection. Instead, it acts more as a visual index, helping to show which documents are connected to each other and which are relevant to a line of investigation being pursued. Consequently, we began working on the problem by dividing the news report collection into four pieces (for the four people on our team doing the investigation). Each of us skimmed the 350+ reports in our own unique subset just to become familiar with general themes discussed in those documents. We also jotted down notes about people, organizations or events to potentially study further. Next, we came together and used Jigsaw to examine the entire news report collection. Jigsaw expects an xml file as input; the file identifies the unique documents and the entities in the documents. We wrote a translator that would change the text reports and the pre-identified entities from the contest data set into the xml form that Jigsaw can read. We then ran Jigsaw and explored a number of the potential leads that we each identified by our initial ∗ e-mail: goerg@cc.gatech.edu zcliu@cc.gatech.edu ‡ e-mail: justneel@gmail.com § e-mail: ksinghal@cc.gatech.edu ¶ e-mail: stasko@cc.gatech.edu † e-mail: skim of the reports. At first we looked for connections across entities, essentially the same people, organizations or incidents being discussed in multiple reports. Surprisingly, there was relatively little in the way of connections across entities in the documents. After about 6 hours of exploration, we really had no definite leads, just many, many possibilities. So we returned to the text reports and some team members read subsets of the reports they had not examined before. At that point, we began to identify some potential “interesting” activities and themes to examine further. What also became clear was that the time we spent earlier exploring the documents in Jigsaw was not wasted time. It helped us become more familiar with many different activities occurring in the reports. Thus, new more deliberate examinations and readings of the documents began to uncover more promising leads. We began to find connections across some actors and organizations in the data set. We were curious, however, why those connections did not show up in Jigsaw initially. Upon returning to the system, we learned why. Some of the key entities in the plot we uncovered (r’Bear, Madhi Kim, Global Ways, Cesar Gil, etc.) were either identified as entities in only some of the documents in which they appeared or they were not identified as entities at all. Jigsaw can only visualize the document and entity information provided to it (it presently has no automated entity identification capabilities), so there was little for us to observe (connections-wise) in our first use of the system on the problem. At this point, we decided that we needed to update the entity information across the document collection. We started with the preidentified entities and we created software that would scan all the text documents and identify places where these entities simply were missed. This process resulted in adding more than 6000 new entityto-document matches over the whole collection, and thus the entityconnection-network became much more dense. The drawback of this technique was that we also added more noise by multiplying unimportant or wrongly extracted entities. Therefore, we manually checked the most frequent entities for validation and made a list of false positive entities (wrongly classified or extracted) for each entity type. We excluded these entities from the document collection and we manually added previously unidentified entities that we noticed while reading the documents. This whole process provided us with a consistent connection network that was mostly devoid of false positives. Since less than one quarter of the entities across the entire collection appeared in more than one report, we added an option in Jigsaw that allows the user to filter out all entities that appear in only one report. Doing so allows us to focus on highly-connected entities at the beginning of the investigation and to add further entities when more specific questions arise later during the analysis. We resumed exploring the documents using Jigsaw and it was much easier for us to track down different plot threads and explore relationships between actors and events given this refined entity information. On our second read of the news reports, we noticed one mentioning the rapper r’Bear being taken to the hospital with bumps on his face. This seemed suspicious so we decided to explore it further. We issued a query on r’Bear which brought his entity into all the views. Expanding his entity in the graph view showed the reports in which he is mentioned. Next we would turn to the text view and examine these reports. The text view highlights all identified entities and helps us see other people, places and organizations, etc., that are candidates for further exploration. We cannot stress enough how important it is to simply read the reports carefully. Jigsaw is helpful in this respect by identifying a small subset of reports that are relevant to an idea being explored and that can be examined closely. In our initial investigations of r’Bear, we noticed connections to Luella Vedric. We selected Vedric in the list view and expanded her set of connected entities. We found Vedric’s connections to Catherine (Collie) Carnes and examined the text reports about her. At this point we noted the mention of the Assan Circus which led to further investigations. By exploring the entity “Assan” we found reports mentioning the Abdul Hassan alias. Manual exploration of the importer/exporter spreadsheet file uncovered the connection between Hassan and Global Ways. Carnes was also mentioned in a report with Faron Gardner, so we investigated him too. Exploring the list view showed that Gardner and Cesar Gil are connected with many of the same entities. Gil was mentioned in the blog texts so we made them into documents and imported them into Jigsaw as well. By examining these views and simply reading the blog, we noted that Cesar Gil went by the chinshopes alias, and we found the connections between Cesar and Collie and Faron that are mentioned in his blog. Working on the VAST contest spurred us to make changes and additions to the Jigsaw view capabilities in the initial version of the system reported in [2]. For instance, Jigsaw’s list view would load all entities of one type in a scrolling list. For this data set with over 2500 people entities, that was simply impractical. Instead, we modified Jigsaw to only load a growing set of entities connected to what is being explored, thus making list examination and interaction much more manageable. We also modified the text view to count the number of times a report had been viewed and to allow each text view to be named. We frequently found our investigations to have many text views present, each with a small number of reports, and naming the view allowed us to recall what the “focus” of the view was. We also added an important new capability to the graph view. Frequently, we would gather a large set of potentially “interesting” reports into the graph view and then expand all the reports to show all their entities. We added an operation, invoked through the “Do Layout” button, that would reposition all the visible reports equidistant around a large circle in the view. Entities connecting to only one report are drawn near that report, but outside the circle. Entities connecting to more than one report are drawn inside the circle. Thus the set of entities easily noticeable inside the circle shows a more highly connected network of entities that may be related in important ways and likely should be examined more closely. Figure 1 shows such a set of interesting reports for the contest data. Note the entities on the inside; many of which are involved in the solution we proposed. 3 R EFLECTIONS AND F UTURE D IRECTIONS Again, we cannot emphasize strongly enough the importance of carefully reading the reports. The challenge with the contest data is that there are about 1500 reports. Jigsaw is very helpful for exploring different entities in its graphical views and then having it load a small subset of the relevant documents in one of its text views. We frequently found ourselves exploring different entities and we would have four or five different Jigsaw text views open, each with only a few documents inside. We could then carefully examine those reports and it was easy to understand the connections between entities and how the pieces began to fit together. Our work on the contest further illustrated the utility, and likely necessity, of having significant screen space available when work- Figure 1: Use of the “Do Layout” command in the graph view. All entities connecting to more than one document are drawn in the middle making it easier to focus on them. ing with Jigsaw. As shown in [2], we run the system on a computer with four LCD monitors and we use those pixels to spread out all the different document views. Performing analysis on only one display would be extremely slow and burdensome because it would require so much window flipping. Our analysis activities exposed a number of shortcomings in the Jigsaw system and thus the activities functioned very much in a formative evaluation sense. We made a number of changes to each view in our system as we were working on the contest, some examples of which were discussed earlier. Probably the key missing feature in the system at this time is the ability to identify or remove entities while running the system during an active investigation. We also noted the need for a more global view of all the reports, one that could show which documents have been examined and that would allow the documents to be partitioned into groups. Finally, since Jigsaw cannot read spreadsheets, we had to examine those contest documents manually. Adding multivariate data handling capabilities as found in spreadsheets would be another useful addition to the system. ACKNOWLEDGEMENTS This research is supported in part by the National Science Foundation via Award IIS-0414667 and the National Visualization and Analytics Center (NVACTM ), a U.S. Department of Homeland Security Program, under the auspices of the Southeast Regional Visualization and Analytics Center. Carsten Görg was supported by a fellowship within the Postdoc-Program of the German Academic Exchange Service (DAAD). R EFERENCES [1] Jigsaw project. http://www.gvu.gatech.edu/ii/jigsaw/. [2] J. Stasko, C. Görg, Z. Liu, and K. Singhal. Supporting Investigative Analysis through Interactive Visualization. In IEEE Symposium on Visual Analytics Science and Technology, 2007.
