An Analysis of the Efficacy of the Springate Bankruptcy Model using
advertisement
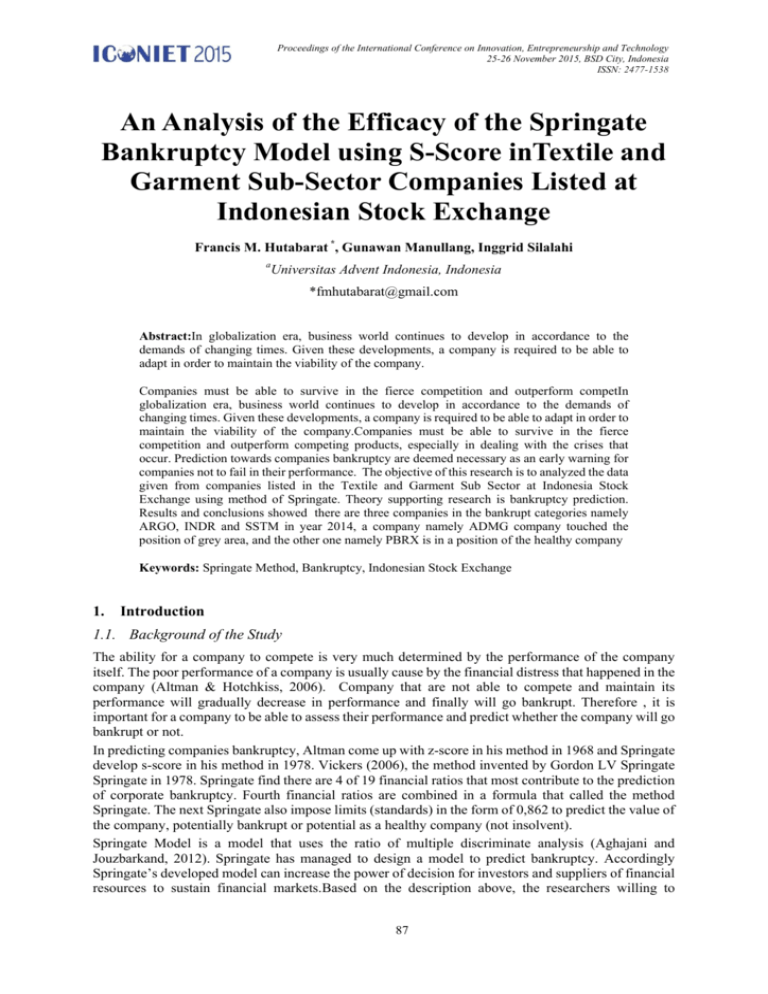
Proceedings of the International Conference on Innovation, Entrepreneurship and Technology 25-26 November 2015, BSD City, Indonesia ISSN: 2477-1538 An Analysis of the Efficacy of the Springate Bankruptcy Model using S-Score inTextile and Garment Sub-Sector Companies Listed at Indonesian Stock Exchange Francis M. Hutabarat *, Gunawan Manullang, Inggrid Silalahi a Universitas Advent Indonesia, Indonesia *fmhutabarat@gmail.com Abstract:In globalization era, business world continues to develop in accordance to the demands of changing times. Given these developments, a company is required to be able to adapt in order to maintain the viability of the company. Companies must be able to survive in the fierce competition and outperform competIn globalization era, business world continues to develop in accordance to the demands of changing times. Given these developments, a company is required to be able to adapt in order to maintain the viability of the company.Companies must be able to survive in the fierce competition and outperform competing products, especially in dealing with the crises that occur. Prediction towards companies bankruptcy are deemed necessary as an early warning for companies not to fail in their performance. The objective of this research is to analyzed the data given from companies listed in the Textile and Garment Sub Sector at Indonesia Stock Exchange using method of Springate. Theory supporting research is bankruptcy prediction. Results and conclusions showed there are three companies in the bankrupt categories namely ARGO, INDR and SSTM in year 2014, a company namely ADMG company touched the position of grey area, and the other one namely PBRX is in a position of the healthy company Keywords: Springate Method, Bankruptcy, Indonesian Stock Exchange 1. Introduction 1.1. Background of the Study The ability for a company to compete is very much determined by the performance of the company itself. The poor performance of a company is usually cause by the financial distress that happened in the company (Altman & Hotchkiss, 2006). Company that are not able to compete and maintain its performance will gradually decrease in performance and finally will go bankrupt. Therefore , it is important for a company to be able to assess their performance and predict whether the company will go bankrupt or not. In predicting companies bankruptcy, Altman come up with z-score in his method in 1968 and Springate develop s-score in his method in 1978. Vickers (2006), the method invented by Gordon LV Springate Springate in 1978. Springate find there are 4 of 19 financial ratios that most contribute to the prediction of corporate bankruptcy. Fourth financial ratios are combined in a formula that called the method Springate. The next Springate also impose limits (standards) in the form of 0,862 to predict the value of the company, potentially bankrupt or potential as a healthy company (not insolvent). Springate Model is a model that uses the ratio of multiple discriminate analysis (Aghajani and Jouzbarkand, 2012). Springate has managed to design a model to predict bankruptcy. Accordingly Springate’s developed model can increase the power of decision for investors and suppliers of financial resources to sustain financial markets.Based on the description above, the researchers willing to 87 Proceedings of the International Conference on Innovation, Entrepreneurship and Technology 25-26 November 2015, BSD City, Indonesia ISSN: 2477-1538 conduct research on on “Financial Distress Analysis: A Study on Company’s Bankruptcy using S-Score Model in Textiles and Garment Sub-Sector Companies Listed at Indonesian Stock Exchange” 1.2. Statement of the Problem Based on the background of the study above, the statement of the problem is to analyze the financial distress of companies listed in Textile Sub-Sector listed at Indonesia Stock Exchange with the following research questions, they are as follows: a. What is the analysis on the bankruptcy potential of PT. Argo Pantes of Textile Sub-Sector Companies listed in the Indonesia Stock Exchange based on Springate method of S-Score from year 2010-2014? b. What is the analysis on the bankruptcy potential of PT. Indo Rama Synthetics of Textile Sub-Sector Companies listed in the Indonesia Stock Exchange based on Springate method of S-Score from year 2010-2014? c. What is the analysis on the bankruptcy potential of PT. Pan Brothers of Textile Sub-Sector Companies listed in the Indonesia Stock Exchange based on Springate method of S-Score from year 2010-2014? d. What is the analysis on the bankruptcy potential of PT. Polychem Indonesia of Textile Sub-Sector Companies listed in the Indonesia Stock Exchange based on Springate method of S-Score from year 2010-2014? 2. Review of Related Literature 2.1. Financial Statement Analysis Financial statements are prepared with the aim of providing a company's financial information to the parties concerned and that require consideration in making decisions. The parties among others are creditors, investors, management, owners, and government. The company's financial statements are prepared as a management tool to consider the viability of their enterprises. In addition, the financial statements also become a major source for investors to invest in investment activities that they do in order to get the benefits they want. According Kartikahadi et al (2012: 145), financial statements are a representation structured of the financial position and financial performance of an entity that aims to provide information about the financial position, financial performance, and cash flows of the entity that benefit the majority of the users of financial statements in making economic and show the results of management accountability for the use of resources entrusted to them. Meanwhile, according to Sumarsan (2013: 35), the financial report is the end result of the accounting cycle that gives the financial picture of a company that is periodically drawn up by the management company. On the other hand, Keown et al (2005) defines financial statement analysis as a selection , evaluation and interpretation of financial data, as well as connecting the other with information that is intended to assist investment decision and finance. Company financial statements are critical in a publicly traded. The financial report is a summary of the recording process, a summary of the financial transactions that occurred during the financial year in question. Financial statement analysis is needed to understand the information which will be useful for decision making in the future. Financial accounting information intended specifically for external users, generally is party investors and creditors (Keown et al, 2005). Analysis can retrieve the necessary data from various sources. The main source is the company’s data provided in the annual report and the disclosure . The annual report can be either an income statement, balance sheet, cash flow, notes From the report, or of information disclosure. According to Juan and Wahyuni (2012: 120), the objective of financial statements is to provide information about the financial position, performance and cash flows of an entity that is useful for a variety of report users in making economic decisions. Meanwhile, according to Ahmed and Belkaoui (2011: 212), The general purpose financial statements is to provide information to interested parties on the financial statements, ranging from the investor or prospective investor, the funders or potential funders in the management of the company itself in the decision. And, according Rivai et al (2013: 375), the objective of financial statements is: 1. Provide information reliable cash on the company's financial position (including banks) at a particular time; 2. Provide reliable financial information regarding the 88 Proceedings of the International Conference on Innovation, Entrepreneurship and Technology 25-26 November 2015, BSD City, Indonesia ISSN: 2477-1538 Company's operating results for a particular accounting period; 3. Provide information that can help the parties concerned to assess or interpret the conditions and the potential of a company;4. Provide other important information relevant to the needs of the parties concerned with the needs of the relevant reports. Financial ratios are part of financial statement analysis. According to Keown et al. (2011: 74) financial ratios helped us to identify some of the weaknesses and the financial strength of the company. The ratio gives two ways how to make a comparison and financial data company, which means: (1) we can examine the ratio between the time (say for the last 5 years) to examine the direction of movement; and (2) we can compare the ratio of companies with ratios of other companies. Mathematically, the financial ratios of no more than the ratio in which the numerator and denominator are taken from financial data. What sounds so simple? Conceptually, yes indeed. According Raharjaputra (2009: 196) is a simple understanding of the ratio is a comparison between the numbers with other figures that give a meaning. An advantage of using ratio is summarizing an enterprise historical data for comparison. Of the many tools of financial analysis, ratio analysis is the most widely used. Kasmir (2013:7) also stated that the financial report is a report that shows the company's financial condition at this time or in a given period. Moreover, Kasmir (2013:7) sees that the financial statements portray the financial posts the company acquired in a period. Based on the explanation above, it can be concluded that the financial statements are statements that are presented to provide information about the condition and financial performance of a company based on accounting principles that apply. 2.2. Bankruptcy Bankruptcy is a situation when a company or a natural person's financial positions low and weak. To theextent that in practice and legal way they are unable to pay their debts and fulfill their obligations. According to the Bankruptcy Act No. 4 In 1998, the debtor has two or more creditors and did not pay at least one debt due and collectable, declared bankrupt by the decision of the authorities, either on their own request, or at the request of one or more creditors.According to Aghajani and Jouzbarkand, (2012), bankruptcy is a situation when a company or a natural person's financial positions low and weak. To the. extent that in practice and legal way they are unable to pay their debts and fulfill their obligations. In 1968 Altman used legal aspects of his studies to describe bankruptcy. Biverin 1966, Damphousse and Zapondis in 2000, and Tampson in 2000 defined bankruptcy from creditors’ point view [9]. They expressed that bankrupt companies are those companies that are unable to do their debt obligations to their creditors (Dewaelheyns and Van Hulle as seen in Aghajani and Jouzbarkand, 2012, p. 10). 2.3. Springate Method Springate make financial distress prediction models in 1978. In the beginning, Springate using a method that is equal with Altman Multiple Discriminant Analysis (MDA). Such as Beaver (1966) and Altman (1968), originally Springate (1978) mengumpulkanrasio-popular financial ratios that can be used to predict financialdistress. The amount initially ratio is 19 ratio. After going through the same test performed Altman (1968), Springate choose four ratios that can reliably distinguish between companies experiencing distress and that no distress. The formula generated models Springate (1978) is as follows: S = 1.03A + 3.07B + 0.66C + 0.4D Where: A = Working capital / total assets B = Net profit before interest and taxes / total assets C = Net profit before taxes / current liabilities D = Sales / total assets With the assessment criteria if the value of S <0,862, the indication of the company faced a serious threat of bankruptcy which, if the value 0.862 <S <1.062 it indicates that management must be careful in managing the assets of the company to avoid bankruptcy, if the value of S> 1.062 then show the company in a sound financial condition and have no problems with finances (not insolvent).This model has a 92.5% accuracy in the tests performed Springate. Several other people have also tested this model and find a level of accuracy that is different. Recent research by Dolejsova (2015) give outcomes of the 89 Proceedings of the International Conference on Innovation, Entrepreneurship and Technology 25-26 November 2015, BSD City, Indonesia ISSN: 2477-1538 evaluation run using the Springate model revealed the enterprises to be financially sound to show that the model is still relevant. 3. Research Method Based on the variables studied, the background and the problem given in the study, then the type of research used in this research is descriptive method. Facts and data obtained during the the study, are processed and analyzed before conclusions drawn based on existing theory, so as to provide an overview of the financial situation of the four company listed in textile and garment Sub Sector in the Manufacturing Sector in Indonesia Stock Exchange. The companies are Argo Pantes (ARGO), Indo Rama Synthetics (INDR), Pan Brothers (PBRX),Sunson Textile Manufacturer (SSTM), and Polychem Indonesia (ADMG). The data used in the analysis was obtained from the financial statements from year period 2010-2014. The research method used to compute the S-Score was drawn from the formula: S = 1.03A + 3.07B + 0.66C + 0.4D (1) The S-score is realized by computing the following: A = working capital / total assets B = earnings before interest and taxes / total assets C = profit before tax / total current liabilities D = sales / total assets The S-Score then analyzed using the following standard: Table 1: S-Score Standard Standard S < 0,862 0.862 <S <1.062 S > 1.062 4. Interpretation Bankrupt or in Financial Distress Solvent but Prone to Bankruptcy Solvent Results of the Study 4.1. Argo Pantes Tbk (ARGO) Number and Table 2 shows ARGO financial ratios that were analyzed using S-Score of Springate Method. Table 2: ARGO S-Score Analysis Analysis Working Capital/Total Asset EBIT/Total Asset EBT/Current Liabilities Sales/Total Asset S-SCORE Standard Prediction Year 2010 -0,07 -0,01 0,18 0,37 0,15 0,862 Bankrupt Year 2011 0,01 -0,08 -0,67 0,50 -0,50 0,862 Bankrupt Year 2012 -0,39 -0,48 -0,23 2,62 -0,99 0,862 Bankrupt Year 2013 0,48 0,09 -0,01 2,45 0,77 0,862 Bankrupt Year 2014 -0,29 -0,17 -0,47 0,72 -0,83 0,862 Bankrupt Based on Table 1 above using the criteria used to predict the bankruptcy of a company with S-Score model, for companies that have a S-Score ≥ 0,862 then it shall be declared not bankrupt and solvent, 90 Proceedings of the International Conference on Innovation, Entrepreneurship and Technology 25-26 November 2015, BSD City, Indonesia ISSN: 2477-1538 while the S-Score ≤ 0,862, it can be declared bankrupt. The results in Table 1, from year 2010 to 2014 the value of S-Score ≤ 0,862 , means that the companies facing the threat of bankruptcy, and it indicates that management must be careful in managing the company's assets and they are prone to bankruptcy as the S-Score < 0.862 from year 2010-2014. 4.2. Indo Rama Synthetics Tbk (INDR) Number and Table 2 below shows INDR financial ratios that were analyzed using S-Score of Springate Method. Table 3: INDR S-Score Analysis Year 2010 0,04 0,05 0,14 1,09 0,44 0,862 Bankrupt Analysis Working Capital/Total Asset EBIT/Total Asset EBT/Current Liabilities Sales/Total Asset S-SCORE Standard Prediction Year 2011 0,04 0,06 0,04 1,16 0,71 0,862 Bankrupt Year 2012 0,04 0,07 0,01 1,08 0,71 0,862 Bankrupt Year 2013 0,05 0,09 0,01 1,03 0,74 0,862 Bankrupt Year 2014 0,03 0,10 0,03 0,98 0,75 0,862 Bankrupt Based on Table 2 above using the criteria used to predict the bankruptcy of a company with S-Score model, for companies that have a S-Score ≥ 0,862 then it shall be declared not bankrupt and solvent, while the S-Score ≤0,862, it can be declared bankrupt.Results in Table 2 from year 2010-2014 the S-Score shows predictions that their financial performance are predicted in bankruptcy, that means that the INDR companies facing the threat of bankruptcy, and it indicates that management must be careful in managing the company's assets and their potential bankruptcy as the S-Score < 0.862 from year 2010-2014.. 4.3. Pan Brothers Tbk (PBRX) Number and Table 3 below shows PBRX financial ratios that were analyzed using S-Score of Springate Method. Table 4: PBRX S-Score Analysis Analysis Working Capital/Total Asset EBIT/Total Asset EBT/Current Liabilities Sales/Total Asset S-SCORE Standard Prediction Year 2010 0,14 0,08 0,08 1,61 1,09 0,862 Solvent Year 2011 0,23 0,08 0,12 1,43 1,13 0,862 Solvent Year 2012 0,18 0,07 0,10 1,35 1,01 0,862 Solvent Year 2013 0,51 0,08 0,21 1,45 1,49 0,862 Solvent Year 2014 0,57 0,04 0,14 0,92 1,16 0,862 Solvent Based on Table 3 above using the criteria used to predict the bankruptcy of a company with S-Score model, for companies that have a S-Score ≥ 0,862 then it shall be declared not bankrupt and solvent, while the S-Score ≤ 0,862, it can be declared bankrupt. Results in Table 3 generates predictions that PBRX company is generally not bankrupt from year 2010-2014 and shows that they are solvent and have a good and healthy financial performance, as seen at 2010 by 1,09 and in 2011 by 1,13 and 2012 by 91 Proceedings of the International Conference on Innovation, Entrepreneurship and Technology 25-26 November 2015, BSD City, Indonesia ISSN: 2477-1538 1,01 also 2013 by 1,49 and 2014 by 1,16. All score shows that S-Score > 0.862. The value of S-Score reached a peak in 2013 with S-score is 1,49. 4.4. Sunson Textile Manufacturer (SSTM) Number and Table 4 below show SSTM financial ratios that were analyzed using S-Score of Springate Method. Table 5: SSTM S-Score Analysis Analysis Working Capital/Total Asset EBIT/Total Asset EBT/Current Liabilities Sales/Total Asset S-SCORE Standard Prediction Year 2010 0,28 0,07 0,06 0,51 1,20 0,862 Year 2011 0,25 0,01 -0,12 0,48 0,98 0,862 Year 2012 0,22 0,02 -0,07 0,68 0,74 0,862 Year 2013 0,12 0,02 -0,05 0,72 0,70 0,862 Year 2014 0,09 0,02 -0,05 0,67 0,56 0,862 Solvent Prone Bankrupt Bankrupt Bankrupt Based on Table 4 above using the criteria used to predict the bankruptcy of a company with S-Score model. A company may be classified as failed when the calculated S-Score value is less than .862. This indicates that the assessment criteria if the value of S-Score ≤ 0,862, means that the companies facing the threat of bankruptcy. If the value 0.862 ≤ S ≤ 1.062 it indicates that management must be careful in managing the company's assets and they are prone to bankruptcy. And when the value of Z > 1.062 then show the company in a sound financial condition and have no problems with finances, thus, they are not insolvent. The results shows that SSTM in the year 2010 has no probles with finances, however, however in the following year 2010 they are prone to bankrupcy,and from year 2012-2014 the S-Score shows that their financial performance are predicted in bankruptcy. 4.5. Polychem Indonesia Tbk (ADMG) Number and Table 4 below show ADMG financial ratios that were analyzed using S-Score of Springate Method. Table 6: ADMG S-Score Analysis Analysis Working Capital/Total Asset EBIT/Total Asset EBT/Current Liabilities Sales/Total Asset S-SCORE Standard Prediction Year 2010 0,38 0,13 2,41 1,00 2,77 0,862 Solvent Year 2011 0,10 0,12 0,28 0,91 1,01 0,862 Prone Year 2012 0,28 0,03 0,40 0,81 1,08 0,862 Bankrupt Year 2013 0,27 0,03 0,16 0,90 0,82 0,862 Bankrupt Year 2014 0,22 -0,03 -0,51 0,96 0,18 0,862 Bankrupt Based on Table 5 above using the criteria used to predict the bankruptcy of a company with S-Score model. A company may be classified as failed when the calculated S-Score value is less than .862. This indicates that the assessment criteria if the value of S-Score ≤ 0,862, means that the companies facing the threat of bankruptcy. If the value 0.862 ≤ S ≤ 1.062 it indicates that management must be careful in managing the company's assets and they are prone to bankruptcy. And when the value of Z > 1.062 then show the company in a sound financial condition and have no problems with finances, thus, they are not 92 Proceedings of the International Conference on Innovation, Entrepreneurship and Technology 25-26 November 2015, BSD City, Indonesia ISSN: 2477-1538 insolvent. The results shows that ADMG in the year 2010 and 2012 has no probles with finances, however in the following year 2011 they are prone to bankrupcy and from year 2013-2014 the S-Score shows that their financial performance are predicted in bankruptcy. 5. Conclusion and Recommendation 5.1. Conclusion Based on the results of the study and the discussion above, the conclusion of the study are as follows: 1. Analysis of bankruptcy potential by using models Springate shows that Argo Pantes (ARGO) is classified as a potentially bankrupt company because the S-Score is below the standard of 0.862. 2. Analysis of bankruptcy potential by using models Springate shows that Indo Rama Synthetics (INDR) is classified as a potentially bankrupt because the S-Score is below the standard of 0.862. 3. Analysis of bankruptcy potential by using models Springate shows that Pan Brothers (PBRX) is classified as solvent and is financially sound because the S-Score is above the standard of 0.862. 4. Analysis of bankruptcy potential by using models Springate shows thatPolychem Indonesia (ADMG) is classified as a potentially bankrupt company since the last three years from year 2012-2014 the S-Score is below the standard of 0.862. 5.2. Recommendation The conclusion on the analysis of bankruptcy of Argo Pantes (ARGO), Indo Rama Synthetics (INDR),Sunson Textile Manufacturer (SSTM), and Polychem Indonesia (ADMG) shows that these companies are potentially bankrupt. From the view of investor, this result can affect the view of investors in investing their capital in these companies. Thus, these companies need to have wake up call to turn this results and turn the company back to the right track. However, the result on Pan Brothers (PBRX) shows that the company is financially sound. And recommend investors to invest in this company.The study are based on prediction model, therefore it is recommended for further research to conduct a another research to see the accuracy of the prediction.The study are based on prediction model, therefore it is recommended for further research to conduct a another research to see the accuracy of the prediction. References Aghajani, V., and M. Jouzbarkand. (2012). The Creation of Bankruptcy Prediction Model Using Springate and SAF Models. IPEDR, Vol. 54. Altman, E. I., and E. (3rd Ed.). USA: Wiley. Hotchkiss. (2006). Corporate Financial Distress and Bankruptcy. Dolejsova, M. (2015). Is it Worth Comparing Different Bankrupcty Model? Acta Universitatis. Vol. 63 Issues 2 2015. Juan & E. T. Wahyuni. (2012). Standar Akuntansi Keuangan. Jakarta: Salemba Empat. Kartikahadi, H., Sinaga, R.U., Syamsul. M., and S. V. Siregar. (2012). Akuntansi Keuangan berdasarkan SAK berbasis IFRS. Jakarta: Salemba Empat. Kasmir. (2013). Analisis Laporan Keuangan (Edisi 1). Jakarta: Rajawali Pers. Keown, A.J, Martin, J.D., Petty, J.W., and D.F.Scott. (2005). Financial Management (10th Edition). New Jersey: Pearson. Keown, A. J, Martin J. D, Petty J.W., and D. F. Scott. (2011). Manajemen Keuangan: Prinsip dan Penerapan(Edisi Kesepuluh). PT INDEKS. Raharjaputra, H. S. (2009). Manajemen Keuangan dan Akuntansi. Jakarta: Salemba Empat. 93 Proceedings of the International Conference on Innovation, Entrepreneurship and Technology 25-26 November 2015, BSD City, Indonesia ISSN: 2477-1538 Riahi, A. & Belkaoui. (2011).Accounting Theory - Teori Akuntansi. Jakarta: Salemba Empat. Rivai, V., Basir S., Sudarto S., and A. P. Veithzal. (2013). Commercial Bank Management – ManajemenPerbankan. Jakarta: PT Rajagrafindo Persada. Vickers, F. (2006).The Dynamic Small Business Managers. Lulu.com. Sumarsan, T. (2013). Sistem Pengendalian Manajemen: Konsep, Aplikasi, dan Pengukuran Kinerja. Jakarta: Indeks. Undang-Undang Republik Indonesia, UU No. 4 Tahun 1998 tentang Kepailitan. 94
