BIL 151 -‐ Mechanisms of Mitosis
advertisement
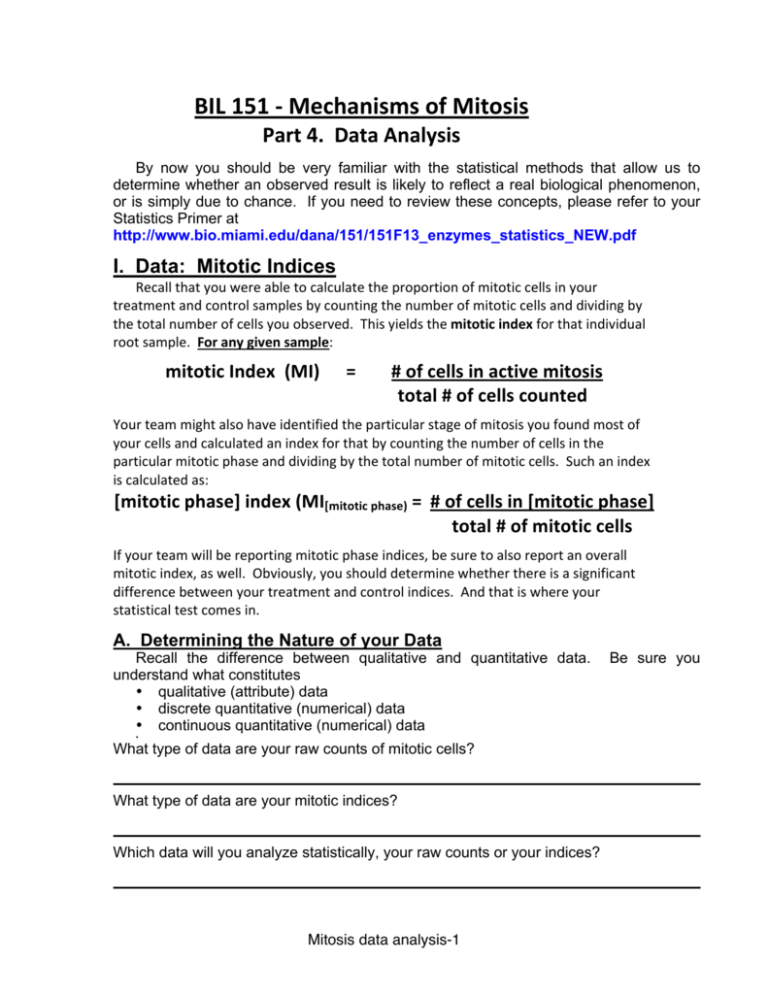
BIL 151 -­‐ Mechanisms of Mitosis Part 4. Data Analysis By now you should be very familiar with the statistical methods that allow us to determine whether an observed result is likely to reflect a real biological phenomenon, or is simply due to chance. If you need to review these concepts, please refer to your Statistics Primer at http://www.bio.miami.edu/dana/151/151F13_enzymes_statistics_NEW.pdf I. Data: Mitotic Indices Recall that you were able to calculate the proportion of mitotic cells in your treatment and control samples by counting the number of mitotic cells and dividing by the total number of cells you observed. This yields the mitotic index for that individual root sample. For any given sample: mitotic Index (MI) = # of cells in active mitosis total # of cells counted Your team might also have identified the particular stage of mitosis you found most of your cells and calculated an index for that by counting the number of cells in the particular mitotic phase and dividing by the total number of mitotic cells. Such an index is calculated as: [mitotic phase] index (MI[mitotic phase) = # of cells in [mitotic phase] total # of mitotic cells If your team will be reporting mitotic phase indices, be sure to also report an overall mitotic index, as well. Obviously, you should determine whether there is a significant difference between your treatment and control indices. And that is where your statistical test comes in. A. Determining the Nature of your Data Recall the difference between qualitative and quantitative data. understand what constitutes • qualitative (attribute) data • discrete quantitative (numerical) data • continuous quantitative (numerical) data • What type of data are your raw counts of mitotic cells? What type of data are your mitotic indices? Which data will you analyze statistically, your raw counts or your indices? Mitosis data analysis-1 Be sure you B. Converting Raw Data to Mitotic Indices Your team measured the number of cells in various stages of mitosis under two different conditions. For each condition you counted cells from at least ten individuals and calculated indices for each individual. This means that you can now calculate a mean mitotic (or mitotic phase) index for each of your two (treatment vs. control) variables/conditions. This should be a simple matter. We’ll wait here while you do it. Control mean mitotic index: Treatment mean mitotic index: If you are calculating indices other than overall mitosis (i.e., for specific phases of mitosis), enter them below. Write the phase of the index in the space provided. Control mean index: Treatment mean Control mean index: index: Treatment mean Control mean Treatment mean index: index: index: C. Variance and Standard Deviation of your Indices Recall how to calculate variance and standard deviation, which are measures of deviations from the mean. The sample variance (s2) is calculated as _ In which x is the sample mean, x is each individual value, and n is the sample size. Remember that you are using indices, not raw cell counts. Perform your calculations accordingly. Mitosis data analysis-2 The standard deviation (s) is the square root of the variance: Calculate the variance for your treatment and control mitotic indices. Control variance: Treatment variance: Calculate the standard deviation for your treatment and control mitotic indices. Control standard deviation: Treatment standard deviation: (If you are considering a particular mitotic phase, then you must also calculate the variance and standard deviation for treatment and control of those indices, as well.) Calculate the variance for your treatment and control [mitotic phase] indices. Control variance: Treatment variance: Calculate the standard deviation for your treatment and control [mitotic phase] indices. Control standard deviation: Treatment standard deviation: D. Independent Sample t Test Remember that the Student’s t-test is used to determine whether a difference between two means is significant (“Significant” in this sense is NOT the same as “biologically meaningful.” It refers only to whether the observed difference is unlikely to be due to chance (“statistically significant”)). If individuals in a single group are subjected to "before and after" measurements, the paired t test is employed. However, the root tip from the onions you used were not measured more than once. Instead, Mitosis data analysis-3 multiple replications of your experiment were done on many individuals. This means that the independent t test is more appropriate for your data. The Independent sample t-test The formula for the independent sample t test is: ...where x1 and and x2 are the means of your two groups, n1 and n2 are the numbers of experimental runs in each group, and sp2 is the pooled variance. This is calculated as: ...where s12 is the variance of group 1, s22 is the variance of group 2, df1 is the degrees of freedom for group 1 (df1 = n1 - 1) and df2 is the degrees of freedom for group 2 (df2 = n1 - 1). The variance (s2) is calculated as _ In which x is the mean, x is each individual value, and n is the sample size. Degrees of Freedom The degrees of freedom for a two-sample t-test with independent means is calculated as the sum of the degrees of freedom of each test group: df = (n1 - 1) + (n2 - 1) What is your t-statistic? What are your degrees of freedom? II. Probability: What do your results tell you? As you may recall, the term "significant" as used in every day conversation is quite different from the very specific meaning of this word in statistics. The difference between an observed and expected result is said to be statistically significant if and only if: Under the assumption that there is no true difference, the probability that the observed difference would be at least as large as that actually seen simply as a matter of chance is less than 0.05 (5%; alpha). This is the probability of making a Type I error (falsely rejecting the null hypothesis). Once your team has calculated a t-statistic, you must draw conclusions from it. How does one determine whether any deviation from the expected (null hypothesis) is Mitosis data analysis-4 significant? Depending upon the degrees of freedom, there is a specific probability value linked to every possible value of the t-statistic. A. Determining the significance level of your t-statistic Once you have calculated a t-statistic for your two sets of dividing cells, you must try to interpret what this statistic tells you about the difference between the two experimental conditions to which you subjected your model organisms (onions). Is the difference significant, suggesting that there is something other than chance causing the deviation? The answer lurks in the table of critical values for the t-statistic, part of which is illustrated in Table 1. 1. Locate the appropriate degrees of freedom in the far left column. 2. Look across the df row to find a t value closest to the one you obtained. 3. If the exact value does not appear on the table, note the two t values which most closely border your value, or the single value that is either greater or smaller than your value. 4. Find the P value(s) that correspond to your bordering values, and enter them in the appropriate space(s) below: > P > Table 1. Table of critical values for the two-sample t-test. The P levels (0.05) indicating rejection of the null hypothesis are shown in bold for both one-tailed and two-tailed hypotheses. (From Pearson and Hartley in Statistics in Medicine by T. Colton, 1974. Little, Brown and Co., Inc.) 2-tail --> 1-tail --> df 1 2 3 4 5 6 7 8 9 10 11 12 13 14 15 16 17 18 19 20 21 22 23 24 25 26 27 28 29 30 0.10 0.05 0.05 0.02 0.02 0.01 0.01 0.005 0.001 0.0005 6.314 2.920 2.353 2.132 2.015 1.934 1.895 1.860 1.833 1.812 1.796 1.782 1.771 1.761 1.753 1.746 1.740 1.734 1.729 1.725 1.721 1.717 1.714 1.711 1.708 1.706 1.703 1.701 1.699 1.697 12.706 4.303 3.182 2.776 2.571 2.447 2.365 2.306 2.262 2.228 2.201 2.179 2.160 2.145 2.131 2.120 2.110 2.101 2.093 2.086 2.080 2.074 2.069 2.064 2.060 2.056 2.052 2.048 2.045 2.042 31.821 6.965 4.541 3.747 3.365 3.143 2.998 2.896 2.821 2.764 2.718 2.681 2.650 2.624 2.602 2.583 2.567 2.552 2.539 2.528 2.518 2.508 2.500 2.492 2.485 2.479 2.473 2.467 2.462 2.457 63.657 9.925 5.841 4.604 4.032 3.707 3.499 3.355 3.250 3.169 3.106 3.055 3.012 2.977 2.947 2.921 2.898 2.878 2.861 2.845 2.831 2.819 2.807 2.797 2.787 2.779 2.771 2.763 2.756 2.750 636.619 31.598 12.941 8.610 6.859 5.959 5.405 5.041 4.781 4.587 4.437 4.318 4.221 4.140 4.073 4.015 3.965 3.922 3.883 3.850 3.819 3.792 3.767 3.745 3.725 3.707 3.690 3.674 3.659 3.646 Mitosis data analysis-5 If the P value associated with your t-statistic is less than (or equal to) 0.05, there is less than 5% probability that the observed mean difference between your treatment and control mitotic indices arose as a matter of chance. If this is the case, you must reject your null hypothesis and fail to reject your alternative hypothesis. (Alternatively, find the t-statistic associated with P = 0.05 at your df. This is called the critical value and if your calculated t-statistic is larger than the critical value from the table, reject your null hypothesis.) Judging from your P value, should you reject your null hypothesis? Briefly explain WHY you believe your statistic indicated that you should reject or fail to reject your null hypothesis. Do you believe your results to be an accurate reflection of true population values? Support your contention, either way. You are now ready to enter the final phase of your project, the production of a scientific poster in professional format. Mitosis data analysis-6
