Projectile Motion Lab
advertisement
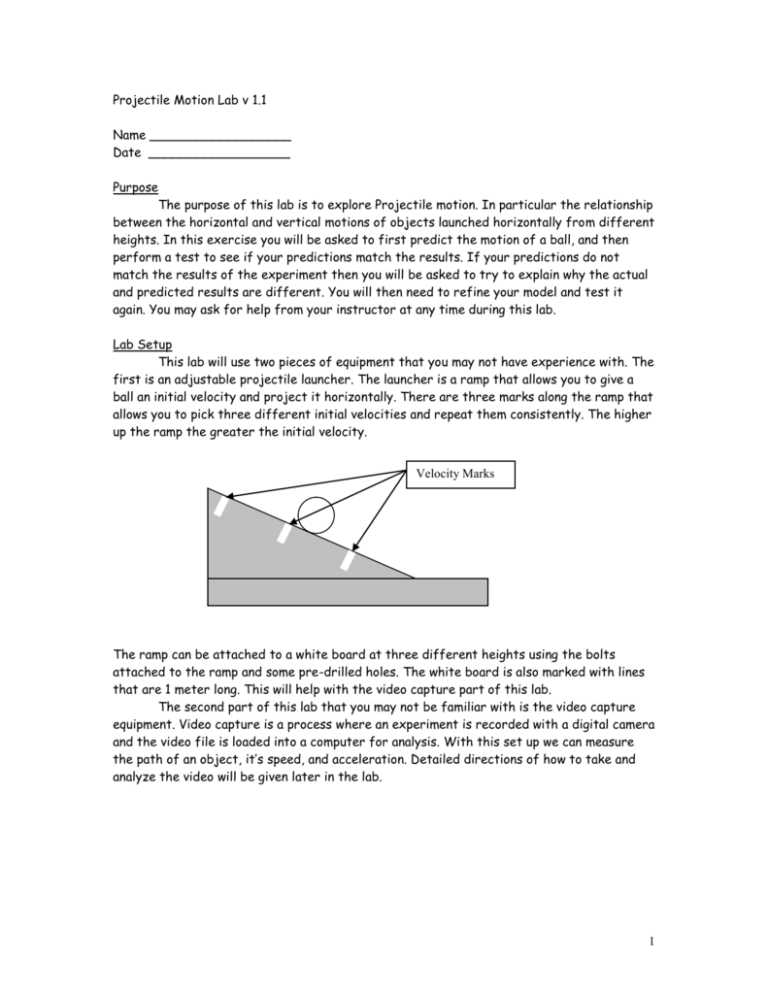
Projectile Motion Lab v 1.1 Name __________________ Date __________________ Purpose The purpose of this lab is to explore Projectile motion. In particular the relationship between the horizontal and vertical motions of objects launched horizontally from different heights. In this exercise you will be asked to first predict the motion of a ball, and then perform a test to see if your predictions match the results. If your predictions do not match the results of the experiment then you will be asked to try to explain why the actual and predicted results are different. You will then need to refine your model and test it again. You may ask for help from your instructor at any time during this lab. Lab Setup This lab will use two pieces of equipment that you may not have experience with. The first is an adjustable projectile launcher. The launcher is a ramp that allows you to give a ball an initial velocity and project it horizontally. There are three marks along the ramp that allows you to pick three different initial velocities and repeat them consistently. The higher up the ramp the greater the initial velocity. Velocity Marks The ramp can be attached to a white board at three different heights using the bolts attached to the ramp and some pre-drilled holes. The white board is also marked with lines that are 1 meter long. This will help with the video capture part of this lab. The second part of this lab that you may not be familiar with is the video capture equipment. Video capture is a process where an experiment is recorded with a digital camera and the video file is loaded into a computer for analysis. With this set up we can measure the path of an object, it’s speed, and acceleration. Detailed directions of how to take and analyze the video will be given later in the lab. 1 Procedure Part 1 In this section we will explore the effect that how high the ball is launched has on the ball’s path. To do this what must we change to see this effect? What must we keep the same? Why? 2 First you must make a prediction on what the path of the ball will look like. In the space below draw the path of the ball as it leaves the ramp at it’s highest setting. Height 1 Now draw the path of the ball launched from one setting lower. Height 2 3 Once you have made your predictions individually, discuss them with the rest of your lab group and decide on the best prediction. When you have a group consensus, draw your group’s predictions on the board that the ramp is attached to. Use two different color markers for the two different ramp heights. Try your best to draw the pictures to scale. In the next part of the lab you will actually be rolling the ball down the ramp and recording it on a camera, so you want the ball to travel right along the line. When you have completed this show your board to the instructor. At this time the instructor will give you a ball to test your predictions. Using the computer/Camera to capture video (See separate sheet) Video Capture Data Once you have the video capture data plotted, see how well the path of the ball followed your prediction. What are the differences? Did the ball travel the distances that you expected? If not what was the difference? Was the shape of the path the same? If not, how were they different? 4 Using the plotting features of the computer program draw the y vs. x graph for both trials in the space below (where y= vertical distance, and x= horizontal distance) Y 0 X Now draw the vertical velocity vs. time graph for both trials Vvert t 5 Finally draw the Horizontal velocity vs. time graph for both trials Vh t How did the vertical velocity change over time? How were the two trials the same/different? How did the horizontal velocity change over time? How were the two trials the same/different? 6 Part Two; In this part of the lab we will explore how the initial horizontal velocity affects the flight of the ball. What do we need to change (in the lab set-up) to see the effect of horizontal velocity on the path of the ball? What must we keep the same? Why? 7 Now make a prediction of what the flight of the ball will look like for two different velocities. Draw what you think the path will look like for the lower velocity. Lower velocity Now draw your prediction for the higher velocity Higher Velocity 8 Once you have made your predictions separately, get together with your lab group and decide on the best prediction. When your group has agreed on a prediction draw it on your board. Again you are going to film the flight of the ball so try to draw the line so that the ball follows it. Use two different color markers for the two different trials. When you are finished call an instructor over to check your work before you go on to the next part. Repeat the procedure from part one for running the trials and capturing the video. Plot the same data that you did for part one. Video Capture Data Once you have the video capture data plotted, see how well the path of the ball followed your prediction. What are the differences? Did the ball travel the distances that you expected? If not what was the difference? Was the shape of the path the same? If not, how were they different? 9 Now use the computer to plot the vertical distance over the horizontal distance. Copy the graph into the space provided. Y 0 X Now plot the vertical velocity over time Vvert t 10 Finally Plot the Horizontal Velocity over time VH T How did the Vertical velocity change over time? How were the two trials same/different? How did the horizontal velocity change over time? How were the two trials same/different? 11 Conclusions From what you have observed, what is the effect of changing the height that a ball is launched from on the ball’s vertical velocity? How about it’s horizontal velocity? What is different when the ball is launched at different horizontal velocities? How are the vertical and horizontal velocities related? 12 Now we will test the observations that you have made and the conclusions that you have formed from them. Assume that we now launch two balls at the same time. The two balls are launched at the same horizontal velocity, but one from the highest setting on the board and the other along the ground. Draw what you think the paths of the two balls will look like. Launched at same time and at same horizontal velocity Once you have made your predictions separately, get together with your lab group and decide on the best prediction. When your group has agreed on a prediction draw it on your board. When you are finished call an instructor over to check your work. At this time you will be given a second ramp to test your prediction. 13 What did you observe when the two balls were launched together? Was this the same or different than you predicted? Explain what you saw and why you think the balls behaved in this way. Does this confirm or contradict the conclusions, about how horizontal and vertical velocities are related that you made in the last section? What do you think the relationship between the horizontal and vertical velocities is now that you have observed this last demonstration? 14

