Chapter 4 - crypt
advertisement
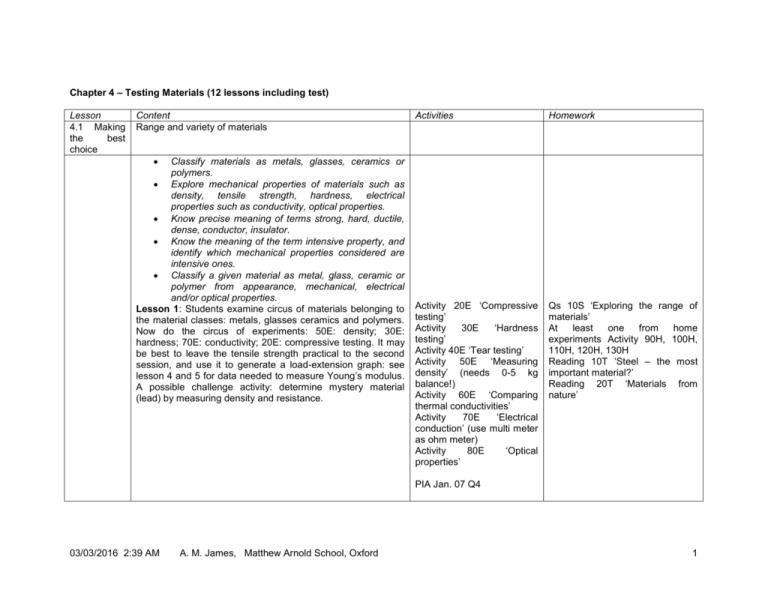
Chapter 4 – Testing Materials (12 lessons including test) Lesson 4.1 Making the best choice Content Range and variety of materials Activities Homework Activity 20E ‘Compressive testing’ Activity 30E ‘Hardness testing’ Activity 40E ‘Tear testing’ Activity 50E ‘Measuring density’ (needs 0-5 kg balance!) Activity 60E ‘Comparing thermal conductivities’ Activity 70E ‘Electrical conduction’ (use multi meter as ohm meter) Activity 80E ‘Optical properties’ Qs 10S ‘Exploring the range of materials’ At least one from home experiments Activity 90H, 100H, 110H, 120H, 130H Reading 10T ‘Steel – the most important material?’ Reading 20T ‘Materials from nature’ Classify materials as metals, glasses, ceramics or polymers. Explore mechanical properties of materials such as density, tensile strength, hardness, electrical properties such as conductivity, optical properties. Know precise meaning of terms strong, hard, ductile, dense, conductor, insulator. Know the meaning of the term intensive property, and identify which mechanical properties considered are intensive ones. Classify a given material as metal, glass, ceramic or polymer from appearance, mechanical, electrical and/or optical properties. Lesson 1: Students examine circus of materials belonging to the material classes: metals, glasses ceramics and polymers. Now do the circus of experiments: 50E: density; 30E: hardness; 70E: conductivity; 20E: compressive testing. It may be best to leave the tensile strength practical to the second session, and use it to generate a load-extension graph: see lesson 4 and 5 for data needed to measure Young’s modulus. A possible challenge activity: determine mystery material (lead) by measuring density and resistance. PIA Jan. 07 Q4 03/03/2016 2:39 AM A. M. James, Matthew Arnold School, Oxford 1 Lesson Content • Record and interpret a load-extension graph for copper Lesson 2: Do Activity 10E/150E to generate a load-extension graph for copper. Use at least 250 cm of 30 SWG copper wire, with a metre stick butted up against the pulley block as a reference scale, and a pointer attached from the wire made from a piece of sticky label.. At this stage, a simple load (in g) against extension (in mm) graph can be plotted, but provided that the wire diameter and length have been noted, the data can be used in a later lesson to calculate the Young’s modulus and yield stress of copper. Activities Homework Activity 150E ‘Good measurement of Young’s modulus’ Note: 250 cm of 0.31 mm diameter copper wire (30 SWG) is suitable. For nylon use 0.10 mm diameter wire. Qs 10S ‘Exploring the range of materials’ At least one from home experiments Activity 90H, 100H, 110H, 120H, 130H Reading 10T ‘Steel – the most important material?’ Reading 20T ‘Materials from nature’ PIA June 07 Q1 Qs p79 Qs 20C ‘The Bronze age’ Qs 30C ‘Portraits in plastic’ Reading 60S ‘More about log scales’ 4.2 Better buildings Tensile testing, stress, strain and Young modulus Investigate breaking stress of a range of materials to develop familiarity with ‘plot and look’ idea for repeat measurements. Appreciate the need for intensive measurements of stress and strain when testing and comparing materials. Lesson 3: Breaking stress of materials using Activity 100E. This is a good activity for ‘plot and look’, provided that the cotton thread option is adopted. When using cotton thread, create a loop knot by doubling over the end of the thread and tying a knot. There is a reel of cotton thread of suitable thickness in the A level Chapter 4 tray. The paper strip experiment is much more fiddly and requires Hoffmann clips. Use the spreadsheet in Activity 100E to show how to anlayse the data in terms of mean, range, spread, standard deviation, 03/03/2016 2:39 AM A. M. James, Matthew Arnold School, Oxford Activity 100E ‘Plot and look: measuring breaking stress of materials’ Activity 150E ‘Good measurement of Young’s modulus’ Reading 40S ‘Hooke’s law and the Young modulus’ 2 Lesson Content and the calculation of stress values, noting that stress is an intensive property. Go through the uncertainty treatment as per Activity 100E. As a demonstration, load nylon fishing line or metal wires to destruction to generate a load extension graph: discuss how the graph varies with the dimensions of the specimen and so lead into a definition of stress and strain (see Activity 150E). Know definitions of tensile and compressive stress and strain, Young’s modulus. Use the relevant equations for stress, strain and the Young’s modulus to perform calculations. Know that the stiffer a material, the greater its Young’s modulus. Lesson 4: Go through the formal definitions of tensile stress (strength) and strain. Note also the compressive equivalents of tensile properties, noting which sorts of materials are strong in compression and which in tension. Do some sample calculations of stress and strain, and introduce the Young modulus as the gradient of the stress strain graph. The question sheet stress, strain and the Young’s modulus covers all the key points. Note the scaling up problem in Hollywood: a giant insect would not be able to support its weight as its weight scales as r3, while the area of its legs scales as r2. Discuss maximum height of mountains being governed by maximum compressive stress at base. Make an accurate and precise measurement of the Young’s Modulus of a material, estimating the uncertainties involved Lesson 5-6: Measure Young’s modulus, and yield stress if possible, using Activity 150E (4 sets) and/or Young’s modulus apparatus. The data obtained in lesson 2 can be used. Typical results are provided on the Excel worksheets embedded in 03/03/2016 2:39 AM A. M. James, Matthew Arnold School, Oxford Activities Homework Qs 50D ‘Stress, strain and the Young’s Modulus’ Qs 45S ‘Calculations on stress strain and the Young’s modulus’ Qs 50S ‘Measuring the Young’s modulus’ Qs 10E ‘Making estimates about mechanical behaviour of materials’ PIA Jan 06 Q10 on maximum height of mountains Qs 50D ‘Stress, strain and the Young’s Modulus’ Qs 45S ‘Calculations on stress strain and the Young’s modulus’ Qs 50S ‘Measuring the Young’s modulus’ Qs 10E ‘Making estimates about mechanical behaviour of materials’ Qs p87 Activity 150E ‘Good measurement of Young’s modulus’ Note: 250 cm of 0.31 mm diameter copper wire (30 SWG) is suitable. For nylon use 0.10 mm diameter wire. Qs 50D ‘Stress, strain and the Young’s Modulus’ Qs 45S ‘Calculations on stress strain and the Young’s modulus’ Qs 50S ‘Measuring the Young’s modulus’ Qs 10E ‘Making estimates about 3 Lesson Content Activity 150E for copper, nylon and rubber. For YM apparatus, see sheet on Using YM apparatus. Equipment required: YM apparatus, 30 SWG copper wire, 100 g masses on hanger, metric micrometer, tape measure In the second session, plot graphs and analyse data, making an estimate of the overall uncertainty in the measurements (see Activity 150E for more detail). Know the meaning of the terms elastic deformation, plastic deformation, yield stress, fracture stress, ductile fracture, brittle fracture, stiff, strong, tough, hard. Sketch stress-strain graphs for ductile and brittle materials, identifying the key regions/points on the graphs as described in the previous bullet point. Sketch stress-strain graphs to illustrate the terms strong and stiff. Interpret stress-strain graph to determine Young’s modulus, yield stress and strain, fracture stress and strain of different materials. Interpret 2-D plots of (for example) strength versus density to select appropriate materials for a particular application. Know which types of material are likely to show ductile or brittle fracture behaviour. Lesson 7: Elastic and plastic deformation, brittle and ductile fracture. Issue a stress-strain graph for mild steel, or use the graph generated from the previous lesson. If not done so already, work out the Young’s Modulus from the initial gradient. Students use the sheet Properties of solid materials from stress strain curves and annotate their plots in the relevant places, recording yield stress and ultimate stress values as well. Examine electron micrographs of the two types of fracture (on OHTs). Do the questions on Interpreting stress strain curves. Begin filling in material template for a typical metal, leaving structural explanation until Chapter 5. 03/03/2016 2:39 AM A. M. James, Matthew Arnold School, Oxford Activities PIA G491 Jan. 09 Q8; Jan. 07 Q8; May 08 Q6 Homework mechanical behaviour of materials’ Qs 40S ‘Analysis of tensile testing experiments’ Qs 40S ‘Hooke’s Law and the Young’s Modulus’ Reading 150T ‘Fantastic fibres’ Qs p87 Begin filling in material template. 4 Lesson 4.3 Conducting well, conducting badly Content Resistance and conductance, resistivity and conductivity Activities Homework Recall and use the equation R=V/I to determine the resistance of a material. Investigate how the resistance of a material changes with length and cross sectional area. Know that the resistance of a material is proportional to its length, inversely proportional to its area, the constant of proportionality depending on the material and its temperature. Lesson 8: Recap electrical resistance as measure of how difficult it is to get current through a material, and recap equation R = V/I. Recap electrical resistance measurements from lesson 1 and how comparisons can be only be made with resistance if lengths and cross sectional areas are the same, indicating the need for an intensive property relating to resistance. Class experiment: variation of R with l and A (use nichrome wires, twisting together to increase area). Use multi meters as ohm meters. Go through the derivation of R = l/A from the experimental observations, and the corresponding equation G = A/l, noting the intensive properties of resistivity and conductivity. See also Physics-online “Resistance in a wire”. Sample calculations on sheet Resistance, conductance, resistivity, conductivity. 03/03/2016 2:39 AM As well as class practical, can demonstrate some of the following: Activity 310E ‘Measuring resistance of good conductors’ Activity 330E ‘Measuring resistance of two insulators’ Activity 340E ‘How the dimensions of a conductor affect resistance’ Activity 345E ‘Introduction to resistivity using conducting paper’ Physics-online “Resistance in a wire” Understand the origin of the equation R = l/A. Recall and use the equation R = l/A to do calculations on the electrical properties of materials. Know that resistivity () is an intensive property that is used for the comparison of the electrical properties of materials. A. M. James, Matthew Arnold School, Oxford 5 Lesson Content Know the meaning of the term conductance (G), and that G=1/R = I/V. Use the equation G = A/l to do calculations on the electrical properties of materials. Know that conductivity ( =1/) is an intensive property that is used for the comparison of the electrical properties of materials. Lesson 9: Formal treatment of R = l/A and G = A/l, if not covered in the previous lesson. Sample calculations, including unit conversion, cross sectional area calculation, blocks as well as wires. See sheet Resistance, conductance, resistivity, conductivity, Activities Homework Selected questions from resources listed to right as exemplars in notes Qs 70S ‘Electrical properties’ Qs 80S ‘Resistivity and conductivity calculations’ Qs 100S ‘Conductance and conductivity’ Qs 20E ‘Making estimates about the electrical properties of materials’ Qs p90 PIA May 08 q8; Jan. 08 Q8 Determine the resistivity of, and hence identify, a range of unknown metals and/or metal alloys. Lesson 10: Determination of resistivity using Activity 350E, OR more simply use multimeter to measure R directly (each student needs: multimeter, 2 leads, 2 crocs, metre stick, access to 30 SWG nichrome, 30 SWG constantan, sellotape, wire cutters) This experiment is essential preparation for the Quality of Measurement coursework task. Analysis: graphical method of plotting R versus 1/A, slope = l. Estimate uncertainties in each of Activity 350E ‘Good measurements of electrical resistivity’ Qs from lesson 8 homework tasks Qs 90X provides a good set of review questions for the work of the whole chapter. the measurements. Conclusion: precision of micrometer has largest overall impact on uncertainty in final result. Note: for 30 SWG nichrome, 1 m has resistance of about 13.4 ohms; for 30 SWG constantan, 1 m has resistance 6.6 ohms. 4.4 Problems of 03/03/2016 2:39 AM Review measurement experiments to derive a set of key factors that should always be considered when A. M. James, Matthew Arnold School, Oxford 6 Lesson measuring mechanical and electrical properties Content Activities making measurements. Lesson 11: Review the three key measurement experiments: 100E (breaking stress), 150E (Young modulus), 350E (resistivity) to draw out the key points in making measurements: 1. dealing with properties that vary from sample to sample (e.g. tensile strength) 2. measuring small quantities (e.g. extension and wire diameter) 3. effect on uncertainty if a quantity is raised to a power (e.g. cross-section proportional to diameter squared) 4. the possible presence of systematic error (e.g. yielding of support under tension; contact resistance). Key points to bear in mind when making measurements: 1. Watch out for natural variations between samples; plot the values and find the range. 2. Start with a rough measurement or calculation, to identify the problems to be solved. 3. Small quantities, close to the resolution of an instrument, are hard to measure with low uncertainty. 4. If A = d 2, the percentage uncertainty in A is double that in d 5. To improve a measurement, identify the largest source of uncertainty and try to reduce that first. 6. Look out for systematic errors and try to remove them. Chapter 4 test. 03/03/2016 2:39 AM A. M. James, Matthew Arnold School, Oxford Homework Qs p94 Qs 210D ‘Calculating uncertainties: Chapters 4-5’ with Qs p96 7
