Statistics GCSE – Guide to Coursework
advertisement
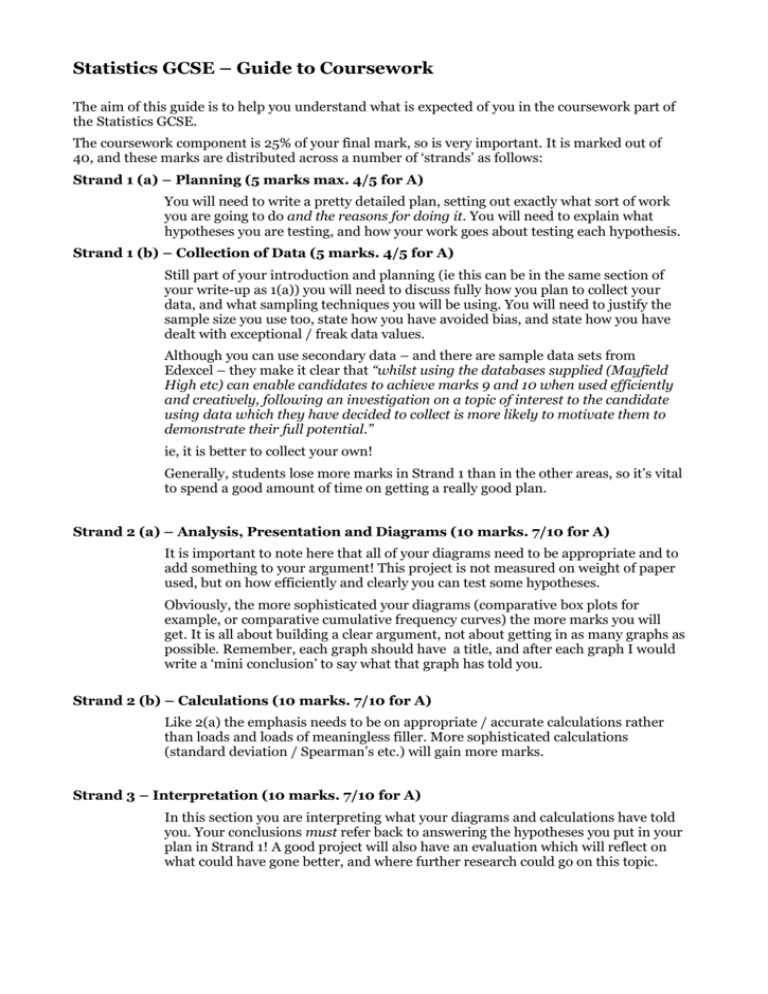
Statistics GCSE – Guide to Coursework The aim of this guide is to help you understand what is expected of you in the coursework part of the Statistics GCSE. The coursework component is 25% of your final mark, so is very important. It is marked out of 40, and these marks are distributed across a number of ‘strands’ as follows: Strand 1 (a) – Planning (5 marks max. 4/5 for A) You will need to write a pretty detailed plan, setting out exactly what sort of work you are going to do and the reasons for doing it. You will need to explain what hypotheses you are testing, and how your work goes about testing each hypothesis. Strand 1 (b) – Collection of Data (5 marks. 4/5 for A) Still part of your introduction and planning (ie this can be in the same section of your write-up as 1(a)) you will need to discuss fully how you plan to collect your data, and what sampling techniques you will be using. You will need to justify the sample size you use too, state how you have avoided bias, and state how you have dealt with exceptional / freak data values. Although you can use secondary data – and there are sample data sets from Edexcel – they make it clear that “whilst using the databases supplied (Mayfield High etc) can enable candidates to achieve marks 9 and 10 when used efficiently and creatively, following an investigation on a topic of interest to the candidate using data which they have decided to collect is more likely to motivate them to demonstrate their full potential.” ie, it is better to collect your own! Generally, students lose more marks in Strand 1 than in the other areas, so it’s vital to spend a good amount of time on getting a really good plan. Strand 2 (a) – Analysis, Presentation and Diagrams (10 marks. 7/10 for A) It is important to note here that all of your diagrams need to be appropriate and to add something to your argument! This project is not measured on weight of paper used, but on how efficiently and clearly you can test some hypotheses. Obviously, the more sophisticated your diagrams (comparative box plots for example, or comparative cumulative frequency curves) the more marks you will get. It is all about building a clear argument, not about getting in as many graphs as possible. Remember, each graph should have a title, and after each graph I would write a ‘mini conclusion’ to say what that graph has told you. Strand 2 (b) – Calculations (10 marks. 7/10 for A) Like 2(a) the emphasis needs to be on appropriate / accurate calculations rather than loads and loads of meaningless filler. More sophisticated calculations (standard deviation / Spearman’s etc.) will gain more marks. Strand 3 – Interpretation (10 marks. 7/10 for A) In this section you are interpreting what your diagrams and calculations have told you. Your conclusions must refer back to answering the hypotheses you put in your plan in Strand 1! A good project will also have an evaluation which will reflect on what could have gone better, and where further research could go on this topic. What Edexcel Say: “A good project will consist of planning, collecting data, processing these data with calculations and diagrams, and an interpretation of the results coupled with a discussion of what these might mean in the context of the real world situation. “A good project will display good statistical thinking, a clear purpose for every technique employed and a good understanding of what the results mean. Whilst it is important to use a range of techniques and skills, these must always be appropriate to the project.” The Data Handling Cycle This diagram may be helpful in thinking about the process of completing the project. When Will We Start? We will be spending some time planning the coursework, so that you have a good project to work on. You will then do some work before half term, and have half term to do the write-up.

