Demonstrating Osmosis in Potato
advertisement
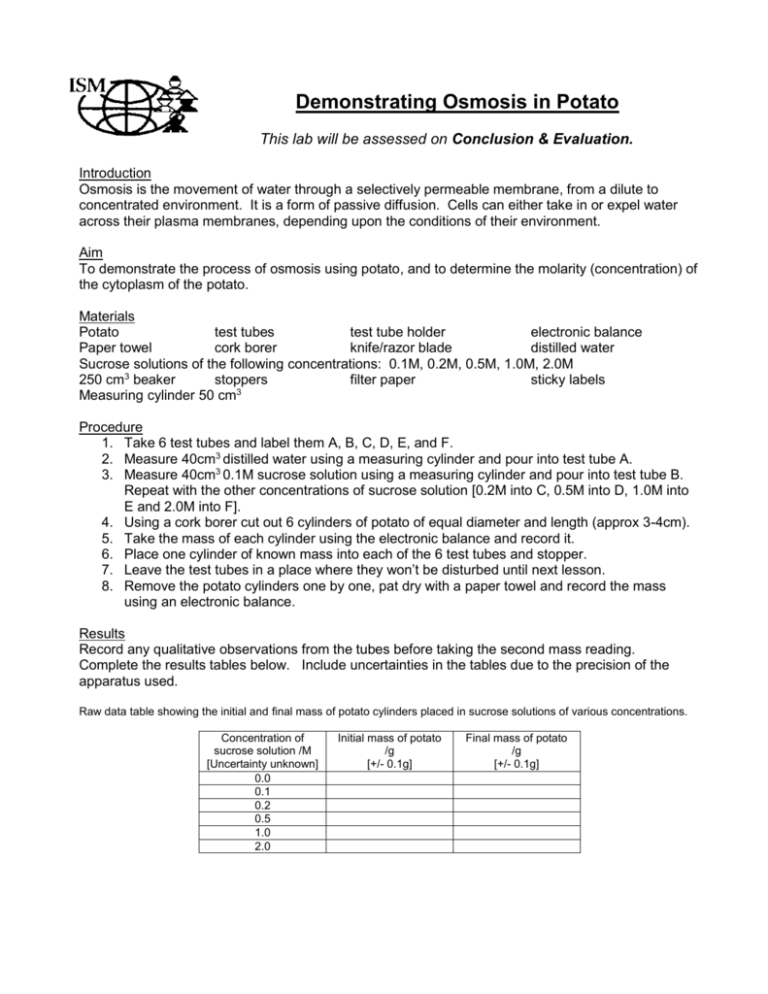
Demonstrating Osmosis in Potato This lab will be assessed on Conclusion & Evaluation. Introduction Osmosis is the movement of water through a selectively permeable membrane, from a dilute to concentrated environment. It is a form of passive diffusion. Cells can either take in or expel water across their plasma membranes, depending upon the conditions of their environment. Aim To demonstrate the process of osmosis using potato, and to determine the molarity (concentration) of the cytoplasm of the potato. Materials Potato test tubes test tube holder electronic balance Paper towel cork borer knife/razor blade distilled water Sucrose solutions of the following concentrations: 0.1M, 0.2M, 0.5M, 1.0M, 2.0M 250 cm3 beaker stoppers filter paper sticky labels Measuring cylinder 50 cm3 Procedure 1. Take 6 test tubes and label them A, B, C, D, E, and F. 2. Measure 40cm3 distilled water using a measuring cylinder and pour into test tube A. 3. Measure 40cm3 0.1M sucrose solution using a measuring cylinder and pour into test tube B. Repeat with the other concentrations of sucrose solution [0.2M into C, 0.5M into D, 1.0M into E and 2.0M into F]. 4. Using a cork borer cut out 6 cylinders of potato of equal diameter and length (approx 3-4cm). 5. Take the mass of each cylinder using the electronic balance and record it. 6. Place one cylinder of known mass into each of the 6 test tubes and stopper. 7. Leave the test tubes in a place where they won’t be disturbed until next lesson. 8. Remove the potato cylinders one by one, pat dry with a paper towel and record the mass using an electronic balance. Results Record any qualitative observations from the tubes before taking the second mass reading. Complete the results tables below. Include uncertainties in the tables due to the precision of the apparatus used. Raw data table showing the initial and final mass of potato cylinders placed in sucrose solutions of various concentrations. Concentration of sucrose solution /M [Uncertainty unknown] 0.0 0.1 0.2 0.5 1.0 2.0 Initial mass of potato /g [+/- 0.1g] Final mass of potato /g [+/- 0.1g] Table showing the mean, maximum and minimum changes and percentage changes in mass of potato cylinders placed in sucrose solution of various concentrations. Concentration Change in Percentage Maximum Maximum Minimum Minimum of sucrose mass of potato change in change in percentage change in percentage solution /M /g mass of potato mass of potato change in mass of potato change in [Uncertainty [+/- 0.2g] /% /g mass of potato /g mass of potato unknown] /% /% 0.0 0.1 0.2 0.5 1.0 2.0 Graph Plot a graph of percentage change in mass of potato (y axis) against concentration of sucrose solution (x axis). Task Conclusion and Evaluation (CE) State a conclusion, with justification, based on a reasonable interpretation of the data obtained. Evaluate weaknesses and limitations in the procedure. Suggest realistic improvements in respect of identified weaknesses and limitations. c=2 p=1 n=0 Concluding Evaluating procedure(s) States a conclusion, with justification, based on a reasonable interpretation of the data. States a conclusion based on a reasonable interpretation of the data. Evaluates weaknesses and limitations. States no conclusion or the conclusion is based on an unreasonable interpretation of the data. Identifies some weaknesses and limitations, but the evaluation is weak or missing. Identifies irrelevant weaknesses and limitations. Improving the investigation Suggests realistic improvements in respect of identified weaknesses and limitations. Suggests only superficial improvements. Suggests unrealistic improvements.
