tables - Karger
advertisement
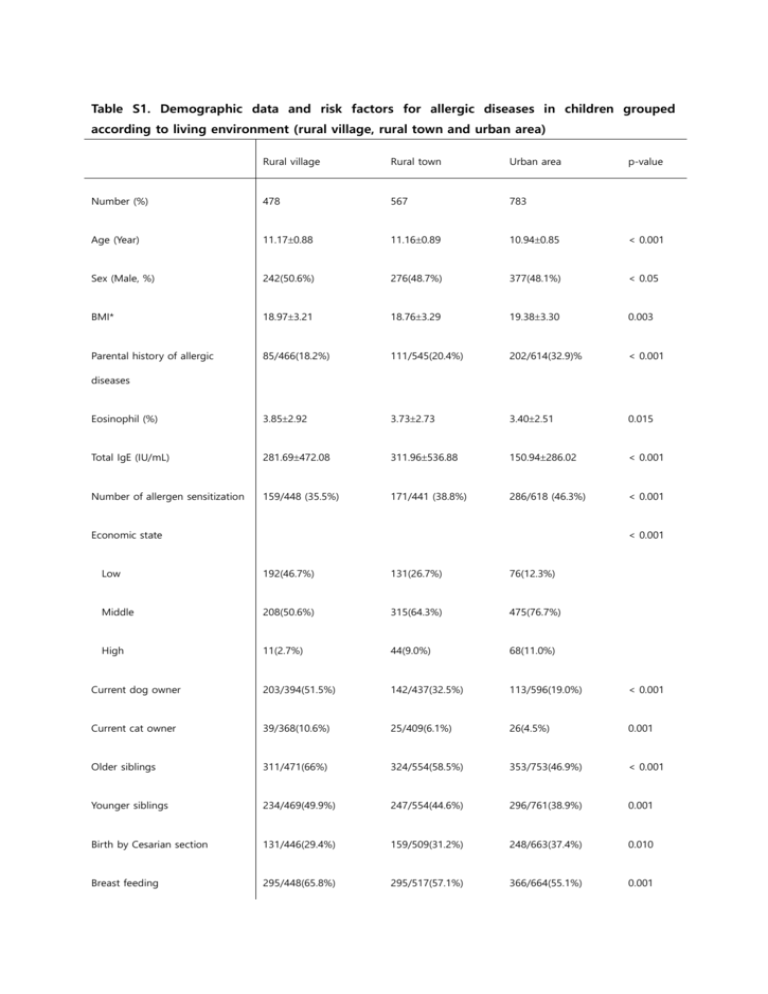
Table S1. Demographic data and risk factors for allergic diseases in children grouped according to living environment (rural village, rural town and urban area) Rural village Rural town Urban area p-value Number (%) 478 567 783 Age (Year) 11.170.88 11.160.89 10.940.85 < 0.001 Sex (Male, %) 242(50.6%) 276(48.7%) 377(48.1%) < 0.05 BMI* 18.973.21 18.763.29 19.383.30 0.003 Parental history of allergic 85/466(18.2%) 111/545(20.4%) 202/614(32.9)% < 0.001 Eosinophil (%) 3.852.92 3.732.73 3.402.51 0.015 Total IgE (IU/mL) 281.69472.08 311.96536.88 150.94286.02 < 0.001 Number of allergen sensitization 159/448 (35.5%) 171/441 (38.8%) 286/618 (46.3%) < 0.001 diseases Economic state < 0.001 Low 192(46.7%) 131(26.7%) 76(12.3%) Middle 208(50.6%) 315(64.3%) 475(76.7%) High 11(2.7%) 44(9.0%) 68(11.0%) Current dog owner 203/394(51.5%) 142/437(32.5%) 113/596(19.0%) < 0.001 Current cat owner 39/368(10.6%) 25/409(6.1%) 26(4.5%) 0.001 Older siblings 311/471(66%) 324/554(58.5%) 353/753(46.9%) < 0.001 Younger siblings 234/469(49.9%) 247/554(44.6%) 296/761(38.9%) 0.001 Birth by Cesarian section 131/446(29.4%) 159/509(31.2%) 248/663(37.4%) 0.010 Breast feeding 295/448(65.8%) 295/517(57.1%) 366/664(55.1%) 0.001 ETS exposure 246/447(55%) 230/505(45.5%) 250/650(38.5%) < 0.001 Antibiotic use during infancy 56/436(12.8%) 113/508(22.2%) 206/667(30.9%) < 0.001 Helminth infection 31/346(9.0%) 30/421(7.1%) 27/568(4.8%) 0.011 Routine vaccination 376/445(84.5%) 439/516(85.1%) 616/667(92.4%) 0.016 Agricultural or livestock farming 207/445(46.5%) 79/507(15.6%) 22/634(3.5%) < 0.001 51/444(11.7%) 17/514(3.3%) 8/661(1.2%) < 0.001 12/429(2.9%) 7/503(1.4%) 11/640(1.7%) 0.233 Pregnancy 56/303(18.5%) 25/364(6.9%) 23/514(4.5%) < 0.001 Aged < 1 yr 75/467(16.1%) 20/545(3.7%) 2/656(0.3%) < 0.001 Current 74/467(15.8%) 20/545(2.8%) 3/656(0.5%) < 0.001 parents Agricultural or livestock farming mother (during pregnancy) Consumption of whole milk Farm animal contact Values represent the means SD or n (%) Statistical analysis was performed using the chi-square test BMI, body mass index; ETS, environmental tobacco smoking Table S2. Multivariate logistic regression analysis of risk factors (adjusted* odds ratio, 95% CI) for allergic diseases and atopy Asthma Asthma Current Allergic Current Atopic Current symptom diagnosis, asthma‡ rhinitis allergic dermatitis atopic ever (VQ) † ever diagnosis rhinitis diagnosis dermatitis ever Agricultural or Atopy ever 1.031 0.834 0.572 0.642 0.582 0.783 0.878 0.910 (0.604- (0.490- (0.190- (0.439- (0.368- (0.555- (0.542- (0.672- 1.759) 1.420) 1.728) 0.940) 0.920) 1.105) 1.424) 1.233) 0.896 0.394 0.553 0.388 0.217 0.279 0.828 (0.205- (0.051- (0.178- (0.085- (0.050- (0.037- (0.332- 3.921) 3.066) 1.714) 1.768) 0.941) 2.127) 2.063) 1.363 0.836 0.582 0.855 0.802 1.182 1.767 1.280 (0.826- (0.506- (0.186- (0.614- (0.543- (0.867- (1.151- (0.962- 2.251) 1.380) 1.824) 1.190) 1.184) 1.611) 2.713) 1.703) 0.879 0.835 1.187 0.565 0.712 0.571 0.542 1.028 (0.410- (0.405- (0.337- (0.330- (0.397- (0.345- (0.256- (0.685- 1.884) 1.720) 4.174) 0.965) 1.277) 0.945) 1.150) 1.545) 1.227 0.768 0.740 0.567 0.567 0.971 0.784 0.925 (0.735- (0.447- (0.275- (0.389- (0.366- (0.698- (0.475- (0.682- 2.050) 1.319) 1.988) 0.824) 0.877) 1.351) 1.295) 1.253) 0.792 0.722 1.513 0.904 0.930 0.913 1.063 0.685 (0.523- (0.487- (0.670- (0.691- (0.680- (0.706- (0.734- (0.540- 1.201) 1.070) 3.416) 1.183) 1.273) 1.181) 1.539) 0.868) livestock farming parents Farm animal - contact during pregnancy Farm animal contact, current Stable ownership Pet ownership Breast milk feeding Birth by 1.160 0.845 0.951 1.121 1.074 0.918 0.941 1.092 (0.749- (0.552- (0.425- (0.846- (0.771- (0.698- (0.639- (0.850- 1.797) 1.294) 2.218) 1.485) 1.496) 1.206) 1.385) 1.402) 0.714 0.582 0.643 0.491 0.556 0.812 1.539 0.691 (0.469- (0.391- (0.295- (0.375- (0.407- (0.627- (1.042- (0.545- 1.087) 0.867) 1.403) 0.642) 0.761) 1.052) 2.273) 0.877) 1.221 1.928 1.824 1.535 1.727 1.597 1.585 1.231 (0.748- (1.262- (0.794- (1.139- (1.231- (1.193- (1.057- (0.931- 1.994) 2.945) 4.189) 2.069) 2.431) 2.136) 2.379) 1.631) 0.816 1.355 3.357 1.169 1.442 0.761 0.577 1.222 (0.284- (0.558- (0.869- (0.637- (0.745- (0.395- (0.203- (0.702- 2.340) 3.295) 12.964) 2.145) 2.793) 1.464) 1.639) 2.216) Cesarian section Older siblings Antibiotic use during infancy Helminth infection * Adjusted for age, sex, parental income, parental history of allergic diseases, BMI, and exposure to tobacco smoke. † Lifetime prevalence of wheezing symptoms defined by video questionnaire (VQ) ‡ Defined as having allergic symptoms within the last 12 months and doctor diagnosis of allergic disease
